
-
Products and Technology
By Category
-
Groups
Activity Groups
Industry Groups
Influence and Feedback Groups
Interest Groups
Location Groups
Customer Only Groups
- Developers
- Partners
- Events
- Help Center
- Topic Pages
-
Explore SAP
Products
- Autonomous Enterprise
- Artificial intelligence
- Data and analytics
- Autonomous Suite
- Technology platform
- Transformation management
- Midsize business solutions
- Financial management
- Spend management
- Supply chain management
- Human capital management
- Customer experience
- Enterprise resource planning
- Business network
- Sustainability management
- SAP Store
- Try SAP
- View all industries
- Partners
- Services
Learning and Support
-
- Products and Technology
- Groups
- Developers
- Partners
- Events
- Help Center
- Topic Pages
-
Explore SAP
- Explore SAP
-
Products
- Products
- Autonomous Enterprise
- Artificial intelligence
- Data and analytics
- Autonomous Suite
- Technology platform
- Transformation management
- Midsize business solutions
- Financial management
- Spend management
- Supply chain management
- Human capital management
- Customer experience
- Enterprise resource planning
- Business network
- Sustainability management
- SAP Store
- Try SAP
- View all industries
- Partners
- Services
- Learning and Support
- About
- SAP Community
- Products and Technology
- Technology
- Technology Q&A
- Cannot create a stacked bar chart
- Subscribe to RSS Feed
- Mark Question as New
- Mark Question as Read
- Bookmark
- Subscribe
- Printer Friendly Page
- Report Inappropriate Content
Cannot create a stacked bar chart
- Subscribe to RSS Feed
- Mark Question as New
- Mark Question as Read
- Bookmark
- Subscribe
- Printer Friendly Page
- Report Inappropriate Content
on 2021 Aug 09 12:55 PM
- SAP Managed Tags
- SAP Crystal Reports
I don't often use charts in CR, but have successfully done so in the past without major problems. This one just will not work for me and I do not understand why. Can someone walk me through it? Using CR 2013/SP6.
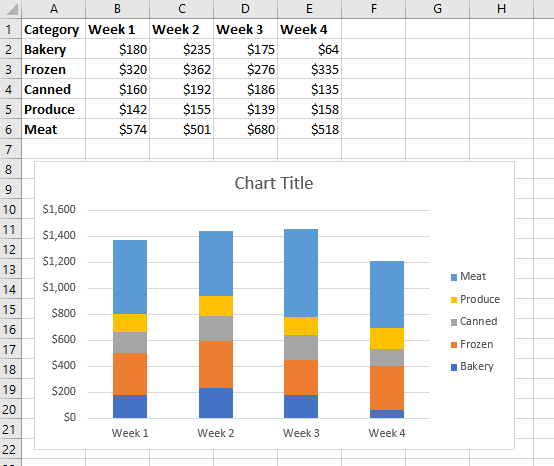
I am trying to do the same within Crystal Reports, but failing miserably. The database is SQL and the data is being gathered by a SQL Command which summarizes the data exactly as shown above - lines 2, 3 ,4, 5, and 6 each represent a single record in the Command's result set.
Need more details?
Request clarification before answering.
Accepted Solutions (0)
Answers (1)
Answers (1)
- Mark as New
- Bookmark
- Subscribe
- Subscribe to RSS Feed
- Permalink
- Report Inappropriate Content
Well, for the longest time, I could not get it to display anything even remotely resembing stacked bars.
Suddenly, I have an actual stacked bar chart, but it is transposed from what I want - The weeks are stacked on top of each other and the Categories are along the X-axis.
You must be a registered user to add a comment. If you've already registered, sign in. Otherwise, register and sign in.
 Bluesky
- Automating SAP HANA System Replication on AWS with Terraform and Ansible in Technology Blog Posts by Members
- SAP BTP - CI - Immutable Kafka Topic Routing Mechanism Using SDIA with ODCP for SAP CPI in Technology Blog Posts by Members
- Get Early Insights to SAP AI Innovations: Join SAP Customer Engagement Initiative Cycle 2 by June 19 in Technology Blog Posts by SAP
- Change of Delivery Class of existing Database tables from 'A' to 'C' for CUBCO in Technology Q&A
- Metadata update has been deferred issue in SSAM in Technology Q&A
| User | Count |
|---|---|
| 9 | |
| 7 | |
| 7 | |
| 4 | |
| 3 | |
| 3 | |
| 3 | |
| 2 | |
| 2 | |
| 2 |
You must be a registered user to add a comment. If you've already registered, sign in. Otherwise, register and sign in.