It is possible to identify some type of network problems and information that could be very useful for further network analysis using HTTP Watch which will help, by example:
- Long Send times. “Send is the time required to send the HTTP request message to the server and will depend on the amount of data that is sent. For example, long Send times will result from uploading files using an HTTP POST” (ref. http://help.httpwatch.com/time_chart.html)
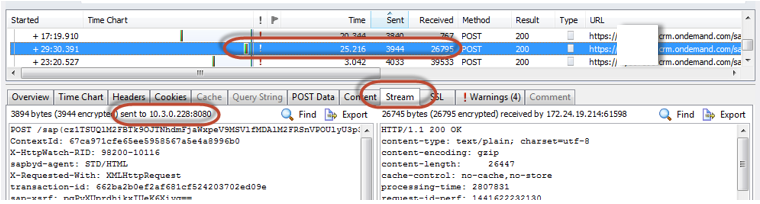
This is an example of a trace that showed high send time and this was observed during the refresh of the ticket list.

On the previous example, it is observed that the first trace took 22 seconds, the upload bandwidth was 0.001Mbps compared to the second trace that only took 0.004 seconds where the bandwidth was 8.1Mbps.
- Long Receive times. “In the same way that we could have long send times we can also have long receive times. Receive is the time taken to read the response message from the server. This value will be depend on the size of the content, network bandwidth and whether HTTP compression was used” (ref. http://help.httpwatch.com/time_chart.html).

The example above shows a very poor bandwidth of only 0.0003 Mbps for download.
- Long TCP connections. “Connect is the time required to create a TCP connection to the web server (or proxy). If a secure HTTPS connection is, being used this time includes the SSL handshake process. Keep-Alive connections are often used to avoid the overhead of repeatedly connecting to the web server” (ref. http://help.httpwatch.com/time_chart.html).
This is another indicator of a potential problem in the network which will impact the user experience.

The previous example shows a very bad case where the connect time was 7.8 seconds.
This could happen between the browser and the proxy, the browser and Akamai or the browser and the SAP load balancing depending on the network configuration.
This is another indicator of a potential problem in the network, which will influence the user experience.

The previous example shows a SSL Handshake of 2.8 seconds, which at the end will impact the end user experience.
- Long blocked times. “The Blocked time includes any pre-processing time (such as cache lookup) and the time spent waiting for a network connection to become available. IE 7 and Firefox 2 will only create a maximum of two concurrent network connections per host name (i.e. www.microsoft.com and will queue up requests until a network connection is available. Often the Blocked time is the most significant factor in the download time of images embedded in a web page” (ref. http://help.httpwatch.com/time_chart.html).
Newer browsers support more concurrent connections but all have limits.
It is important to mention that this could be caused by a network problem but also by a computer problem, in order to try to reduce the variables is recommended to use another browser and see if it behaves the same or start the browser in safe mode to remove the noise cause by add-on (long block times could also mean a slow computer or device).

The example above we can see block times of over 500 milliseconds with apparently no other parallel HTTP request happening, which could be a good indication that something is not correct in the PC or the network.
- IP of host to where PC/browser is connecting. Following the same scenario from the send time example showed before and after realizing that browser took almost 23 seconds to send only 3.9 KB of data what is important is to know to who the browser was sending the data
Within the HTTP Watch Studio selecting the request that has the long send time under the “Stream” tab we can see the IP of the host to where the browser send the data, in this case is 10.3.0.228
Normally this will either be the IP of the Akamai server, SAP load balancing (when Akamai is not active) or the forward proxy.
As it was identified before the IP which is receiving the data from the browser is 10.3.0.228, which means it is private IP and for that reason it can be deduct that there is a on premise proxy being used and the long send time is within the customer network, from the PC where the browser is running to the forward proxy
- Other Scenarios. Long DNS Lookup, browser exceptions, or others could be catch and it will depend if the browser detects a network error like ERROR_INTERNET CONNECTION_ABORTED, ERROR_INTERNET_NAME_NOT_RESOLVED, ERROR_INTERNET_CONNECTION_RESET, etc.

