
- SAP Community
- Products and Technology
- Enterprise Resource Planning
- ERP Blogs by SAP
- Financial Accounting for service industry in SAP S...
Enterprise Resource Planning Blogs by SAP
Get insights and updates about cloud ERP and RISE with SAP, SAP S/4HANA and SAP S/4HANA Cloud, and more enterprise management capabilities with SAP blog posts.
Turn on suggestions
Auto-suggest helps you quickly narrow down your search results by suggesting possible matches as you type.
Showing results for
Product and Topic Expert
Options
- Subscribe to RSS Feed
- Mark as New
- Mark as Read
- Bookmark
- Subscribe
- Printer Friendly Page
- Report Inappropriate Content
01-27-2019
5:26 PM
Co-Authored by Rene Kirchhoff and Stefan Walz
In this blog we would like to show you how SAP S/4HANA Cloud enables customers to get hierarchical market segment reporting based on profit centers, which are the key reporting attribute in the service industry. Aggregated reporting and hierarchies can be built based on profit center attributes – including extensibility fields. We will show how reporting looks like and the step-by-step approach for achieving it, and how easy it is to define various hierarchies and manage the profit center attributes. We will also show how to update the profit center attributes if for example a profit center reorganization takes place.
The profit center: the key reporting attribute in the service industry
Service companies are subdivided into many teams who are in charge of realized revenues and margins. In professional services companies, the lead for such an entity is very often a partner, while in the service industry it is the service manager. In SAP S/4HANA these teams should be represented by the profit center.
The responsible profit center can be maintained in the customer project on the billing item level, in service order it is derived on item level, to allow monitoring of revenue and cost of service by responsible team, in customer project scenario real-time margin too - see financial accounting 4 customer projects blog 1
The profit center is assigned to the cost centers too, thus the periodic costs and the over-/under absorption of the cost centers are included in the profitability margin by profit center.
The P&L and company result can then be broken down by profit center.
In addition, balance sheet KPIs - such as accrued and deferred revenue from revenue recognition and accounts receivables out of project billing and subsequent payment processes - are available at profit center level.
Furthermore, there is a requirement to provide the margin and balance sheet KPIs by market segments like line of service, region, or industry. Typically, in the service industry each team/ profit center can be assigned to these market segment attributes. The market segment KPIs can then be provided by profit center aggregation.
Outside S/4HANA Cloud, there are two options which companies use to achieve market segment reporting:
In order to provide a simplified and more transparent solution, we delivered the tool of flexible hierarchy based on profit center attributes, which are extensible by customers.
Market segment reporting based on flexible profit center hierarchies
Flexible hierarchies are based on the following idea: instead of setting up a static assignment of a profit center to several profit center groups, it is rather about “classifying” profit centers and building hierarchies based on this classification.
Let´s build an example:
The market segments of a company are Line of Service, Industry and Region- see figure 1
 Figure 1: PC hierarchy example – attributes and their values
With the help of the profit center extensibility these attributes are added to the profit center master data and can be maintained with the Manage Profit Centers app.
 Figure 2: Extensibility fields are maintained in the PC master data
We can now assign every profit center of the organization to
Now we set up two profit center hierarchies:
Hierarchy 1
Level 1: Line of Service
Level 2: Industry
Level 3: Region
With this hierarchy for example you can drilldown on the profitability of a line of service by industry and the by region
Hierarchy 2
Level 1: Region
Level 2: Industry
Level 3: Line of Service
Here for example you can drilldown on the profitability of a region.
The flexible hierarchy is created using the Manage Flexible Hierarchies app - see next chapter.
All released hierarchies can now be used in grid-based reports, for which the profit center is available as a dimension.
As an example, let´s have a look at the Project Profitability app, which provides an overview on all customer project related KPIs.
As a first step, we select Profit Center as a dimension. By right-clicking the profit center, we can select the hierarchy which we would like to include.
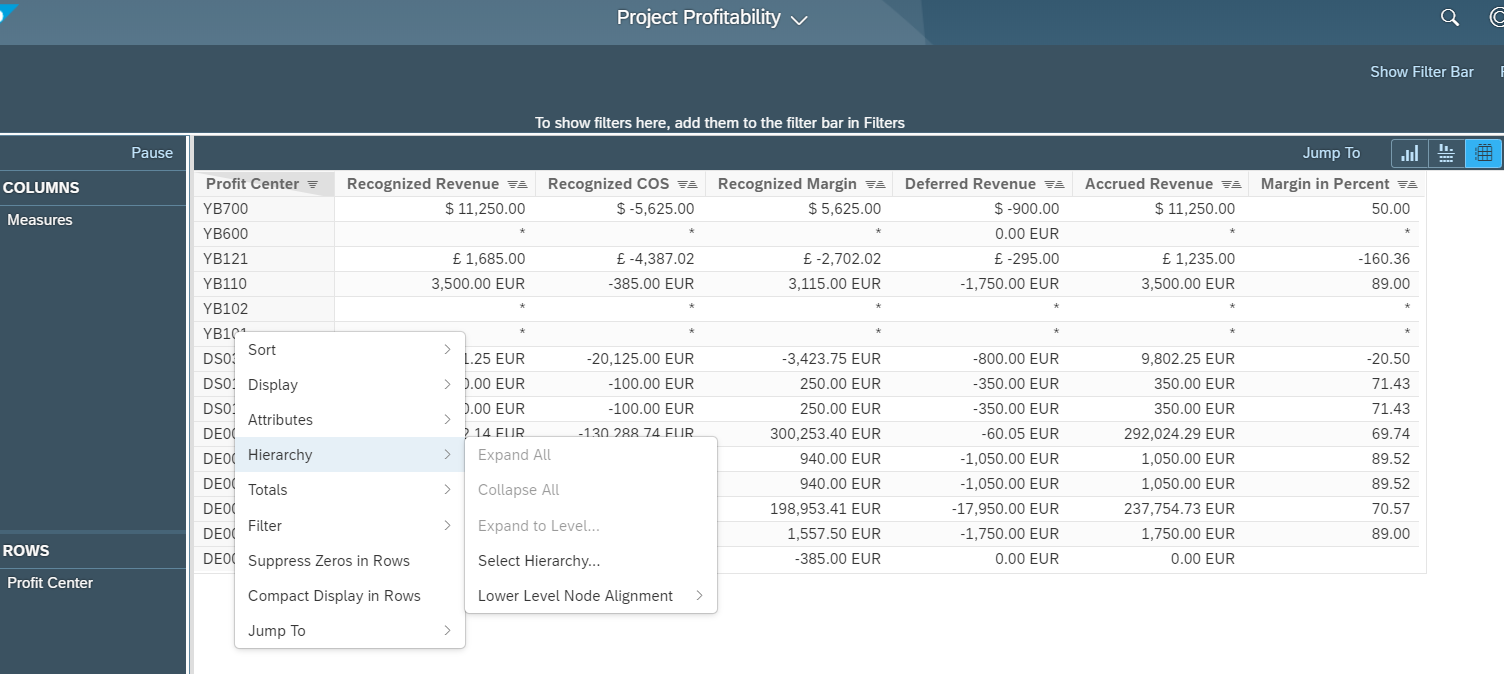 Figure3: Select PC hierarchy in the Project Profitability app
We select the hierarchy 1 with Line of Service -> Industry -> Region and get the report see figure 4.

Figure4: Reporting based on flexible hierarchy 1 - Line of Service -> Industry -> Region
You can see that the hierarchy is built by the profit center attributes. This looks much more transparent than having here multiple profit center hierarchies.
Now let’s change to hierarchy 2 - Region -> Industry -> Line of Service – see figure 5.
 Figure 5: Reporting based on flexible hierarchy 2 - Region -> Industry -> Line of Service
The hierarchy works for the Origin Profit center too, if the customer wants to see the margin not based on the responsible PC, but on the supporting PC - see blog 3.
Technical set-up of flexible hierarchies
Steps for enabling Flexible Hierarchies for profit centers:
We start with the Custom Fields and Logic app.
As a first step, we need to prepare the profit centers for the classification. For this, three custom fields are added to the profit center with the Profit Center Master Data business context: Region, Industry, Line of Service
In our example we provide for every attribute a code list for allowed values.
 Figure 6: Code list of values extensibility fields – example for “Line of service”
One remark: Please make sure to enable the usage of the field on the Profit Center screen as well as on the Profit Center in Flexible Hierarchy screen - see figure 7
 Figure 7: Usage of the extensibility fields – example for “Line of service”
The custom fields are now available in the profit center master data.
In the second step, the profit centers need to be classified by maintaining the attributes using the Manage Profit Centers app – see figure 2.
This manual procedure is relevant when creating a new profit center for which a value of a certain attribute is being defined. For initial creation of hierarchies of already existing profit centers, there is an option to assign the attributes in a simpler way – this is described in the next chapter.
Finally, the hierarchy can be created. Instead of building up the hierarchy statically by assigning each profit center to a profit center group, we will now leverage the profit center extensibility fields which we created.
The flexible hierarchy is created using the Manage Flexible Hierarchies app.
The app shows a list of all flexible hierarchies which are already created. By pressing “+”, a new hierarchy is created. The following fields need to be filled:
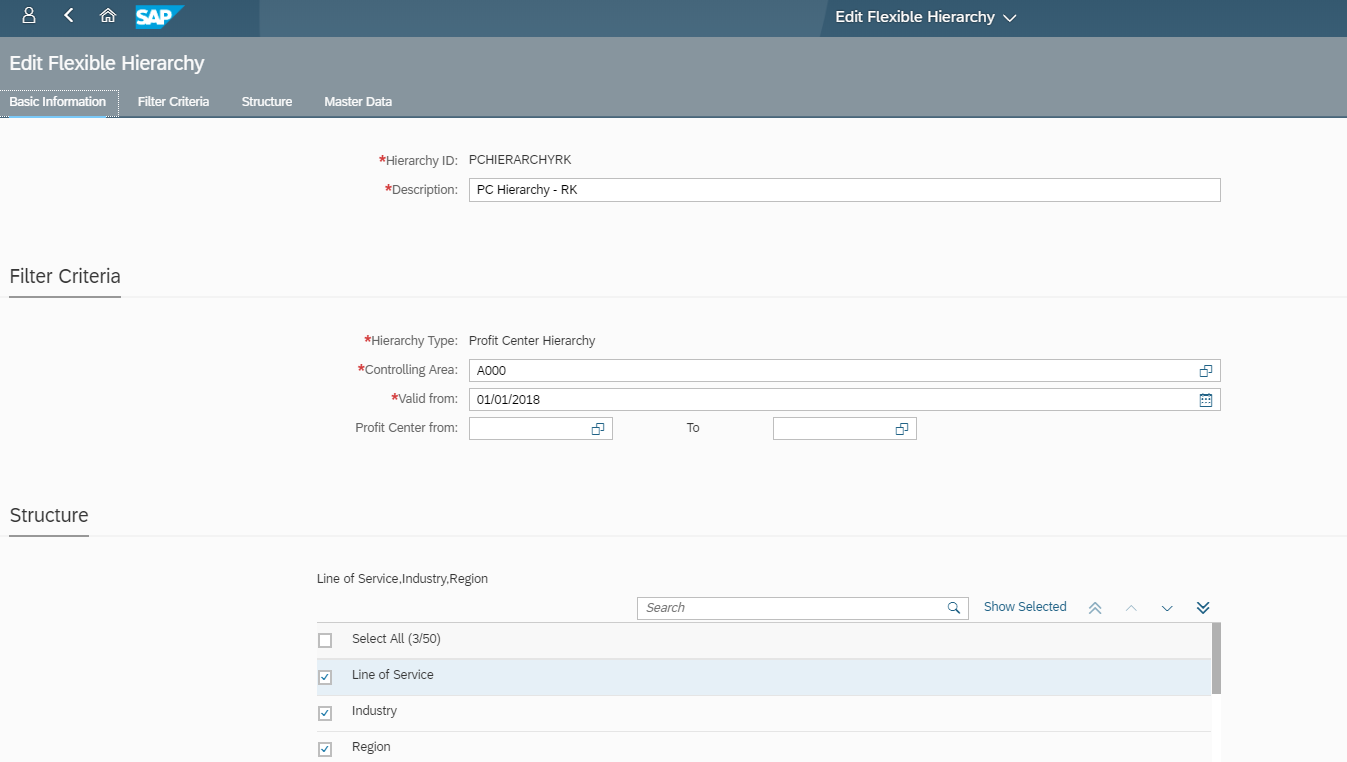 Figure 8: Create flexible Hierarchy for profit center
Under the Structure group, the profit center attributes are selected which are relevant for building this specific hierarchy. The sequence defines the level. Here our hierarchy 1 is defined:
Level 1: Line of Service
Level 2: Industry
Level 3: Region
The hierarchy is built up automatically based on the maintained values in the code list of the extensibility field. By switching to Preview mode, we already see how the hierarchy will look like:

Figure 9: Preview of Hierarchy in the Edit Flexible Hierarchy app
Once the hierarchy is submitted, it is available for reporting. Note that the reporting relevance and the Replicate Runtime Hierarchy step are done automatically when the hierarchy is submitted. The profit center hierarchy is stored in own database to allow high-performance reporting.
If a different view is required, a second hierarchy can easily be built. Let´s stick to our hierarchy example 2:
Level 1: Region
Level 2: Industry
Level 3: Line of Service
 Figure 10: Flexible Hierarchy for Profit center – example hierarchy 2
So instead of building a completely new static hierarchy, the new hierarchy can easily be built simply by selecting the profit center attributes in a different order.
Simplified maintenance of flexible hierarchies – for example handling of reorganizations
There is a very convenient way to maintain the profit center attributes – especially in the case of reorganizations which frequently occur in the service industry.
For example, what happens if the organization changes and two regions need to be merged in market segment reporting? In our example, the two regions EMEA and MEE are merged.
The flexible hierarchies offer the possibility not only to build the hierarchy itself, but also to easily (re-)assign the values of the profit center attributes.
This feature is provided in the Manage Flexible Hierarchies app in the Master Data section.
 Figure 11: Flexible Hierarchy for Profit center – update attribute values
By pressing Update Master Data, we can download the current master data of each profit center to an Excel spreadsheet:
The created file exposes a list of all profit centers with their actual values per attribute.
 Figure 12: Excel - download for PC extensibility fields
In this Excel, we can edit the values and automatically upload them afterwards.
Sticking to our scenario, to merge the two regions EMEA and MEE into EMEA, all profit centers with region 02 will get region 01. Figure 13 shows the adapted assignment:
 Figure 13: Change of attribute Region in Excel
We will now upload the new assignment and have a look at the new preview:
 Figure 14: preview after Region merge
In the new hierarchy the MEE is gone and merged into EMEA.
In this blog we would like to show you how SAP S/4HANA Cloud enables customers to get hierarchical market segment reporting based on profit centers, which are the key reporting attribute in the service industry. Aggregated reporting and hierarchies can be built based on profit center attributes – including extensibility fields. We will show how reporting looks like and the step-by-step approach for achieving it, and how easy it is to define various hierarchies and manage the profit center attributes. We will also show how to update the profit center attributes if for example a profit center reorganization takes place.
The profit center: the key reporting attribute in the service industry
Service companies are subdivided into many teams who are in charge of realized revenues and margins. In professional services companies, the lead for such an entity is very often a partner, while in the service industry it is the service manager. In SAP S/4HANA these teams should be represented by the profit center.
The responsible profit center can be maintained in the customer project on the billing item level, in service order it is derived on item level, to allow monitoring of revenue and cost of service by responsible team, in customer project scenario real-time margin too - see financial accounting 4 customer projects blog 1
The profit center is assigned to the cost centers too, thus the periodic costs and the over-/under absorption of the cost centers are included in the profitability margin by profit center.
The P&L and company result can then be broken down by profit center.
In addition, balance sheet KPIs - such as accrued and deferred revenue from revenue recognition and accounts receivables out of project billing and subsequent payment processes - are available at profit center level.
Furthermore, there is a requirement to provide the margin and balance sheet KPIs by market segments like line of service, region, or industry. Typically, in the service industry each team/ profit center can be assigned to these market segment attributes. The market segment KPIs can then be provided by profit center aggregation.
Outside S/4HANA Cloud, there are two options which companies use to achieve market segment reporting:
- Market segmentation based on the sales order attributes like organizational units
Revenues and costs of sales per market segment were provided on the sales order level. In addition, the periodic costs and the over-/under absorption of the cost centers was settled to profitability/ market segment - Creation of (static) profit center groups
A separate hierarchy of profit center groups has to be created for each market segment view. In this case, management of the hierarchies is cumbersome and time-consuming - especially in the case of organizational changes which are very common in the service industry.
In order to provide a simplified and more transparent solution, we delivered the tool of flexible hierarchy based on profit center attributes, which are extensible by customers.
Market segment reporting based on flexible profit center hierarchies
Flexible hierarchies are based on the following idea: instead of setting up a static assignment of a profit center to several profit center groups, it is rather about “classifying” profit centers and building hierarchies based on this classification.
Let´s build an example:
The market segments of a company are Line of Service, Industry and Region- see figure 1
Figure 1: PC hierarchy example – attributes and their valuesWith the help of the profit center extensibility these attributes are added to the profit center master data and can be maintained with the Manage Profit Centers app.
Figure 2: Extensibility fields are maintained in the PC master dataWe can now assign every profit center of the organization to
- A region it is working in
- An industry it delivers to
- A line of service it belongs to.
Now we set up two profit center hierarchies:
Hierarchy 1
Level 1: Line of Service
Level 2: Industry
Level 3: Region
With this hierarchy for example you can drilldown on the profitability of a line of service by industry and the by region
Hierarchy 2
Level 1: Region
Level 2: Industry
Level 3: Line of Service
Here for example you can drilldown on the profitability of a region.
The flexible hierarchy is created using the Manage Flexible Hierarchies app - see next chapter.
All released hierarchies can now be used in grid-based reports, for which the profit center is available as a dimension.
As an example, let´s have a look at the Project Profitability app, which provides an overview on all customer project related KPIs.
As a first step, we select Profit Center as a dimension. By right-clicking the profit center, we can select the hierarchy which we would like to include.
Figure3: Select PC hierarchy in the Project Profitability appWe select the hierarchy 1 with Line of Service -> Industry -> Region and get the report see figure 4.
Figure4: Reporting based on flexible hierarchy 1 - Line of Service -> Industry -> Region
You can see that the hierarchy is built by the profit center attributes. This looks much more transparent than having here multiple profit center hierarchies.
Now let’s change to hierarchy 2 - Region -> Industry -> Line of Service – see figure 5.
Figure 5: Reporting based on flexible hierarchy 2 - Region -> Industry -> Line of ServiceThe hierarchy works for the Origin Profit center too, if the customer wants to see the margin not based on the responsible PC, but on the supporting PC - see blog 3.
Technical set-up of flexible hierarchies
Steps for enabling Flexible Hierarchies for profit centers:
- Custom Fields and Logic app: Add additional attributes to the profit center master: region, industry, line of service
- Manage Profit Centers app: Maintain the profit center attributes
- Manage Flexible Hierarchies app: Build flexible hierarchies and release for reporting
We start with the Custom Fields and Logic app.
As a first step, we need to prepare the profit centers for the classification. For this, three custom fields are added to the profit center with the Profit Center Master Data business context: Region, Industry, Line of Service
In our example we provide for every attribute a code list for allowed values.
Figure 6: Code list of values extensibility fields – example for “Line of service”One remark: Please make sure to enable the usage of the field on the Profit Center screen as well as on the Profit Center in Flexible Hierarchy screen - see figure 7
Figure 7: Usage of the extensibility fields – example for “Line of service”The custom fields are now available in the profit center master data.
In the second step, the profit centers need to be classified by maintaining the attributes using the Manage Profit Centers app – see figure 2.
This manual procedure is relevant when creating a new profit center for which a value of a certain attribute is being defined. For initial creation of hierarchies of already existing profit centers, there is an option to assign the attributes in a simpler way – this is described in the next chapter.
Finally, the hierarchy can be created. Instead of building up the hierarchy statically by assigning each profit center to a profit center group, we will now leverage the profit center extensibility fields which we created.
The flexible hierarchy is created using the Manage Flexible Hierarchies app.
The app shows a list of all flexible hierarchies which are already created. By pressing “+”, a new hierarchy is created. The following fields need to be filled:
- Hierarchy ID
- Description
- Hierarchy Type: “Profit Center Hierarchy”
- Controlling Area: A000
- Valid From
- Profit Center From/To – option for restriction on profit centers
Figure 8: Create flexible Hierarchy for profit centerUnder the Structure group, the profit center attributes are selected which are relevant for building this specific hierarchy. The sequence defines the level. Here our hierarchy 1 is defined:
Level 1: Line of Service
Level 2: Industry
Level 3: Region
The hierarchy is built up automatically based on the maintained values in the code list of the extensibility field. By switching to Preview mode, we already see how the hierarchy will look like:
Figure 9: Preview of Hierarchy in the Edit Flexible Hierarchy app
Once the hierarchy is submitted, it is available for reporting. Note that the reporting relevance and the Replicate Runtime Hierarchy step are done automatically when the hierarchy is submitted. The profit center hierarchy is stored in own database to allow high-performance reporting.
If a different view is required, a second hierarchy can easily be built. Let´s stick to our hierarchy example 2:
Level 1: Region
Level 2: Industry
Level 3: Line of Service
Figure 10: Flexible Hierarchy for Profit center – example hierarchy 2So instead of building a completely new static hierarchy, the new hierarchy can easily be built simply by selecting the profit center attributes in a different order.
Simplified maintenance of flexible hierarchies – for example handling of reorganizations
There is a very convenient way to maintain the profit center attributes – especially in the case of reorganizations which frequently occur in the service industry.
For example, what happens if the organization changes and two regions need to be merged in market segment reporting? In our example, the two regions EMEA and MEE are merged.
The flexible hierarchies offer the possibility not only to build the hierarchy itself, but also to easily (re-)assign the values of the profit center attributes.
This feature is provided in the Manage Flexible Hierarchies app in the Master Data section.
Figure 11: Flexible Hierarchy for Profit center – update attribute valuesBy pressing Update Master Data, we can download the current master data of each profit center to an Excel spreadsheet:
The created file exposes a list of all profit centers with their actual values per attribute.
Figure 12: Excel - download for PC extensibility fieldsIn this Excel, we can edit the values and automatically upload them afterwards.
Sticking to our scenario, to merge the two regions EMEA and MEE into EMEA, all profit centers with region 02 will get region 01. Figure 13 shows the adapted assignment:
Figure 13: Change of attribute Region in ExcelWe will now upload the new assignment and have a look at the new preview:
Figure 14: preview after Region mergeIn the new hierarchy the MEE is gone and merged into EMEA.
- SAP Managed Tags:
- SAP S/4HANA Finance,
- SAP S/4HANA Public Cloud
Labels:
You must be a registered user to add a comment. If you've already registered, sign in. Otherwise, register and sign in.
Labels in this area
-
Artificial Intelligence (AI)
1 -
Business Trends
363 -
Business Trends
29 -
Customer COE Basics and Fundamentals
1 -
Digital Transformation with Cloud ERP (DT)
1 -
Event Information
461 -
Event Information
27 -
Expert Insights
114 -
Expert Insights
182 -
General
1 -
Governance and Organization
1 -
Introduction
1 -
Life at SAP
415 -
Life at SAP
2 -
Product Updates
4,682 -
Product Updates
263 -
Roadmap and Strategy
1 -
Technology Updates
1,500 -
Technology Updates
97
Related Content
- Why YCOA? The value of the standard Chart of Accounts in S/4HANA Cloud Public Edition. in Enterprise Resource Planning Blogs by SAP
- Behavior of Advanced Foreign Currency Valuation after Clearing in Enterprise Resource Planning Blogs by SAP
- Assign Accounting Principles to Ledgers and Company Code: SAP Public Cloud in Enterprise Resource Planning Blogs by Members
- Recap of SAP S/4HANA 2023 Highlights Webinar: Service in Enterprise Resource Planning Blogs by SAP
- Recap of SAP S/4HANA 2023 Highlights Webinar: Sourcing and Procurement in Enterprise Resource Planning Blogs by SAP
Top kudoed authors
| User | Count |
|---|---|
| 10 | |
| 6 | |
| 4 | |
| 4 | |
| 3 | |
| 3 | |
| 3 | |
| 3 | |
| 2 | |
| 2 |