
- SAP Community
- Products and Technology
- CRM and Customer Experience
- CRM and CX Blogs by SAP
- Best practices for SAP Cloud for Customer Analytic...
CRM and CX Blogs by SAP
Stay up-to-date on the latest developments and product news about intelligent customer experience and CRM technologies through blog posts from SAP experts.
Turn on suggestions
Auto-suggest helps you quickly narrow down your search results by suggesting possible matches as you type.
Showing results for
former_member53
Explorer
Options
- Subscribe to RSS Feed
- Mark as New
- Mark as Read
- Bookmark
- Subscribe
- Printer Friendly Page
- Report Inappropriate Content
01-22-2018
1:59 PM
Im Shiny from SAP C4C Performance Engineering Team playing the role of a Performance/Quality senior Engineer. After having worked with several customers we have collected the best practices,tips,tricks, do , don't do's which will help benefit maximum possible performance for Analytics Reports.
In this blog we target to share best practices for experienced Customers/Expert end users who would like to troubleshoot poor performing reports in detail and analyze to benefit maximum performance following some technically collected tips and practices.
In case you are analyzing a poorly performing reports do have a look at the below best practices and detailed examples we have put together
SAP Cloud for Customer comes with its own analytical reporting features, capabilities and strengths. These capabilities should not be compared with other primary (independent) reporting / analytical tool, proper evaluation should be done to design and implement each business reporting use case optimally.
Before going through the best practices for joining Data Sources lets understand how joins work technically.
Lets understand the concept of Inner and Outer Joins
----Table explaining inner and outer joins
What actually happens during a join?
Calculation Direction: Data is fetched from Left to right member.

Below are 2 Videos which will help you understand how to improve the design of the Join Data Source Model to instantly achieve better Performance
We will show you examples of sub-optimal and optimal ways to join Data Sources and explain what could be improved or changed in the sub-optimal case to arrive at the optimal case for better performance
Its better to create a Matrix i.e visualize how you would like to design the Joins of the Data sources on a table and re-arrange them accordingly to benefit maximum performance. Below is an example
Best Practices - Selection Data Source Matrix
KPI
Dashboard
Home Page
Report Modeling
We encourage you to follow these simple best practices and design your reports.
We will keep updating this blog with similar experiences and more examples which can help you design reports in a efficient way.
In case you wish to collect performance reports or need a basic overview please do visit the basic version of this blog here: https://blogs.sap.com/2016/05/27/sap-cloud-for-customer-how-to-identify-sub-optimal-reports/
In this blog we target to share best practices for experienced Customers/Expert end users who would like to troubleshoot poor performing reports in detail and analyze to benefit maximum performance following some technically collected tips and practices.
In case you are analyzing a poorly performing reports do have a look at the below best practices and detailed examples we have put together
SAP Cloud for Customer comes with its own analytical reporting features, capabilities and strengths. These capabilities should not be compared with other primary (independent) reporting / analytical tool, proper evaluation should be done to design and implement each business reporting use case optimally.
1. Best Practices – Join Data Source Modeling
Before going through the best practices for joining Data Sources lets understand how joins work technically.
How Joins work?
Lets understand the concept of Inner and Outer Joins
----Table explaining inner and outer joins
What actually happens during a join?
Calculation Direction: Data is fetched from Left to right member.
Important Join Calculation aspects
- Join is always between 2 Data Arrays
- The Data will be fetched from individual data sources in order, one at a time
- The Join calculation happens at run time
- Data from left member is looped through to get the matching right member data to create a temporary array of data- "Join Pair"
- More the data on the Left member more the time it takes to get the final results from the right member
Best Practices-Modeling
- Inner joins are preferred approach
- Left outer joins should be avoided, if unavoidable-
- Can be joined separately, after inner joins
- The data is fetched from the left to the right join member
- For this reason, to improve performance, the anchor of your data source should be the one containing least records
-If there are more than 2 join members, sort them by increasing data volume, i.e. the smallest data source should be the anchor, the next bigger one should be to the right of it, and the largest data source should be to the very right of the table. - The start data source ( Anchor),
- Should be the one that returns least number of unique records
- If possible mandatory selection conditions should be applied - Selections on the reports should define the position of the Data Source
- Refer to the "Selection" - "Data Source" matrix as a guide to evolve the data model
- In case, some of the modelling requirements are generic; these data sources should be pre-delivered as standard content
- Design the report in advance of creating a new joined Data Source in C4C, following best practices. Think through what Characteristics and Key Figures are necessary. Define which fields can be used for Selection. This will help identify whether there is an existing Data Source that can meet your requirements. It will also help you determine whether you need to create any custom Key Figures for your Data Source.
- If a field is not available in the Data Source for a Report, consider using ‘Add Fields’ in the Report before creating a new joined Data Source. Many Data Sources already are able to access attributes of related objects without requiring the creation of a new joined Data Source.
- Inner Joins are a preferred over Left Outer Joins. Left Outer Joins should be avoided.
- Avoid joining multiple Data Sources. If unavoidable, create any Inner Joins together first. Only then, create the Left Outer Join separately.
- For a common requirement please provide feedback to SAP for evaluation if it can be delivered as a standard Data Source in a future release.
Examples of Optimal Join Data Source Modelling to achieve better performance
Below are 2 Videos which will help you understand how to improve the design of the Join Data Source Model to instantly achieve better Performance
We will show you examples of sub-optimal and optimal ways to join Data Sources and explain what could be improved or changed in the sub-optimal case to arrive at the optimal case for better performance
- To see Contacts list belonging to particular Relationship name
- To see all opportunities for an employee having accounts in his/her responsibility
Combined Data Sources
- Combined data sources make sense where all involved data sources have many characteristics in common, but have different key figures. If there are only very few matches between the characteristics, a join might return better results. For example, you would like to see the combined revenue of a company, irrespective of whether it is coming from sales orders or service orders. So you can create a combined data source on sales orders and service orders to see the aggregated revenue of a company.
- Combined data sources tend to be better in terms of performance. In a join, the data volume is multiplied MxN, depending on the join conditions. Hence it is also advisable to reduce the number of join conditions if possible.
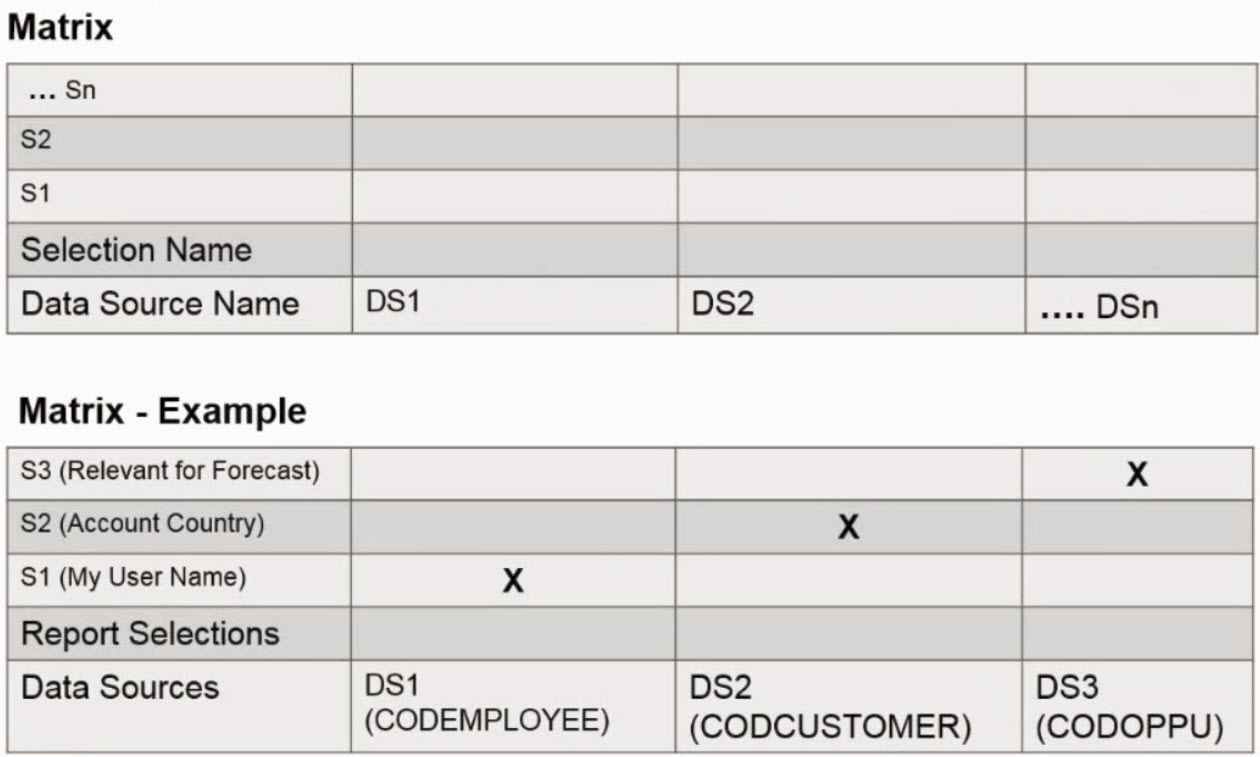
Selection/Data Source Matrix
Its better to create a Matrix i.e visualize how you would like to design the Joins of the Data sources on a table and re-arrange them accordingly to benefit maximum performance. Below is an example
Best Practices - Selection Data Source Matrix
2. Best Practices – KPI, Dashboard & Homepage
KPI
- Discuss and define the KPIs for end-users. Design KPIs based on business roles.
- Review if you need multiple context reports vs context Dashboard
- Consider using dynamic target and reference using reports.
Dashboard
- Organize related reports in dashboards. Dashboards must have business meaning (i.e. Pipeline, Forecast, General Opportunity Data).
- Define logical mapping between reports. Do not put circular connections.
- Do not add long-running, unaggregated Reports to Dashboards. Keep these Reports in the Analysis work center, if they must be made available to users.
- Try to use only graphical reports in dashboard.
- Dashboards should be easily consumable. Consider a mobile use case as well.
Home Page
- Add only tiles that are absolutely necessary for homepage reporting. Try to limit Homepage to KPI tiles, if possible.
- Do not use homepage as a Launchpad. Consider marking reports as favorite instead.
3. Best Practices – Reporting
Report Modeling
- If a standard report is close to what your users need and is already built on the Data Source that will best serve your needs, copy that standard Report to a new Report and adjust the new Report to suit your needs.
- If a field is available in Data Source directly add it through report wizard instead of using ‘Add Fields’.
- If possible, reports on join Data Sources should have selections from all data sources used in join.
- Avoid using negative selection conditions.
- For detailed level reports add mandatory selections. Consider using relative selects.
- Reduce report drilldown to required fields only. End user has an ability to add fields to drill down and save their own views based on their requirements.
- Avoid using column drilldown.
- Design the default Selections such that results are aggregated. Leverage Report-to-Report navigation for drill down, passing the Selection conditions of the source Report to the target Report, reducing the result set of the target Report.
- Avoid adding Characteristics, especially Selections, to a Report that reference a UUID (“Uninterpreted sequence of bytes”). Usually there is an ‘ID’ version of the same field available in Data Source. The ID field will always have ‘ID’ suffixed to it Choose the ID over the UUID field to experience better Performance
E.g.
'Account ID’ is the ID field.

While 'Account' is the UUID field
Buffer Hierarchy
- Hierarchies:It is recommended to use not more than one hierarchy in a report. Consider using hierarchy buffering in such cases.
You can enable buffering to improve the performance of hierarchical based reporting. You can either schedule it periodically by specifying the frequency or opt for ad hoc schedule to run it as required.
This function is useful, for example, if you have large hierarchies and extensive hierarchical reporting. On execution of this job, the system will buffer the hierarchies and keep the hierarchical data ready for quick reference during report execution thereby helping you improve the report execution performance.
Procedure
Go to Business Analytics-> Common Tasks and click on Buffer Hierarchies to open a new window. The system shows you a list of all the hierarchies for which buffering is supported.

Select a hierarchy and click on Schedule Buffering. You have an option of scheduling it in one of the following ways:

- Ad hoc: This allows you to buffer the hierarchy as and when required by manually clicking the Start Now button on the Buffer Hierarchies screen.
Periodically: This enables you to specify the frequency at which you would like to buffer the hierarchy.

3. Select your option and click Save and Close. Based on the settings, the system will execute the job periodically, or you can execute it manually when required.
In the Buffer Hierarchies screen, you can stop, start or pause the buffering anytime you want.
The Execution Status column shows you the last run status. If you want to see more details, refer to the Last Run Logs tab on your screen.
For more details on Buffer Hierarchy follow: https://help.sap.com/viewer/66e9a9081a7b40e38c8604d6617d0311/1711/en-US/e3a6fb16f6f0452fa983195e46c8...
Best Practices- Testing
- Testing should always be done in smaller parts
- Test data should be set up for all individual data sources (part providers)
- Testing for the complex scenario with multiple and complex join should be done as last step
- First, each part provider should be first be tested with a respective test reports and right selection conditions
- This helps to identify the missing records early in the chain
- It gives clues if the joins are incorrect
- Data set up is not expected - Once the lower level part providers are tested, the overlying hierarchy of joins can be tested in step by step manner
We encourage you to follow these simple best practices and design your reports.
We will keep updating this blog with similar experiences and more examples which can help you design reports in a efficient way.
In case you wish to collect performance reports or need a basic overview please do visit the basic version of this blog here: https://blogs.sap.com/2016/05/27/sap-cloud-for-customer-how-to-identify-sub-optimal-reports/
- SAP Managed Tags:
- C4C Analytics
3 Comments
You must be a registered user to add a comment. If you've already registered, sign in. Otherwise, register and sign in.
Labels in this area
-
Business Trends
270 -
Business Trends
14 -
chitchat
1 -
customerexperience
1 -
Event Information
256 -
Event Information
20 -
Expert Insights
30 -
Expert Insights
56 -
Life at SAP
133 -
Life at SAP
1 -
Product Updates
666 -
Product Updates
36 -
SAP HANA Service
1 -
SAPHANACloud
1 -
SAPHANAService
1 -
Technology Updates
453 -
Technology Updates
16
Related Content
- Content Studio - Form Performance Reporting in CRM and CX Questions
- Clean Core within SAP Sales and Service Cloud extensions in CRM and CX Blogs by Members
- SAP Commerce Best Practices for Performance in CRM and CX Blogs by SAP
- SAP Commerce Cloud Q1 ‘24 Release Highlights in CRM and CX Blogs by SAP
- SAP Premium Engagement Session 'A new SAP UX experience utilizing the BTP platform', April 11, 2024 in CRM and CX Blogs by SAP
Top kudoed authors
| User | Count |
|---|---|
| 10 | |
| 2 | |
| 2 | |
| 1 | |
| 1 | |
| 1 | |
| 1 | |
| 1 | |
| 1 | |
| 1 |