New SAP IBP for inventory features delivered in the 1611 release enhance inventory planning decisions:
- Root cause analysis on safety stock drivers
- Constraint of Internal Service Levels to Upper/Lower Bounds
- Safety stock calculation based on allocation policy for product locations with direct and indirect demand
Root cause analysis on safety stock drivers
SAP IBP for inventory’s Global (Multistage) Inventory Optimization operator generates new output key figures providing visibility to root causes of recommended safety stock. Supply Chain Planners can now understand how much demand, supply and service uncertainties drive recommended safety stock quantities at the week-product-location level. Output key figure Safety Stock due to Demand Variability (SAFETYSTOCKDEMANDVAR) quantifies safety stock driven by primarily the forecast error coefficient of variation over the exposure period (sum of lead time and periods between review). Output key figure Safety Stock due to Supply Variability (SAFETYSTOCKSUPPLYVAR) quantifies the incremental safety stock driven by lead time coefficient of variation of both production and transportation. Finally, output key figure Safety Stock due to Service Variability (SAFETYSTOCKSERVICEVAR) quantifies the incremental safety stock driven by changes in internal service levels of upstream nodes of the supply chain. The sum of these three output key figures equals to output key figure RECOMMENDEDSAFETYSTOCK. Since the values are incremental, the above sequence of calculation matters.
Figure 1 shows a graphic example of a 13-week trend projection of safety stock broken down by the safety stock driver key figures. In this example, service variability drives 76% of recommended safety stock followed by demand variability (19%).
Figure 1

Figure 2 shows another example where Supply Chain Planners can view safety stock drivers. In this case, via an Excel-based Planning View, the planners can perform a comparative analysis of safety stock drivers by location region and location type. Independent of location region, service variability explains 100% of recommended safety stock at Plant location types. Demand variability explains 39% of recommended safety stock at Warehouse locations in Brazil compared to 23% in Warehouse locations on India.
Figure 2

Users can configure key figures that calculate percentage values of these three new output key figures at the product-location level so they can build uncertainty indexes. Figure 3 shows an example of an uncertainty index by product, including finished products, component products and sub-component products.
Figure 3

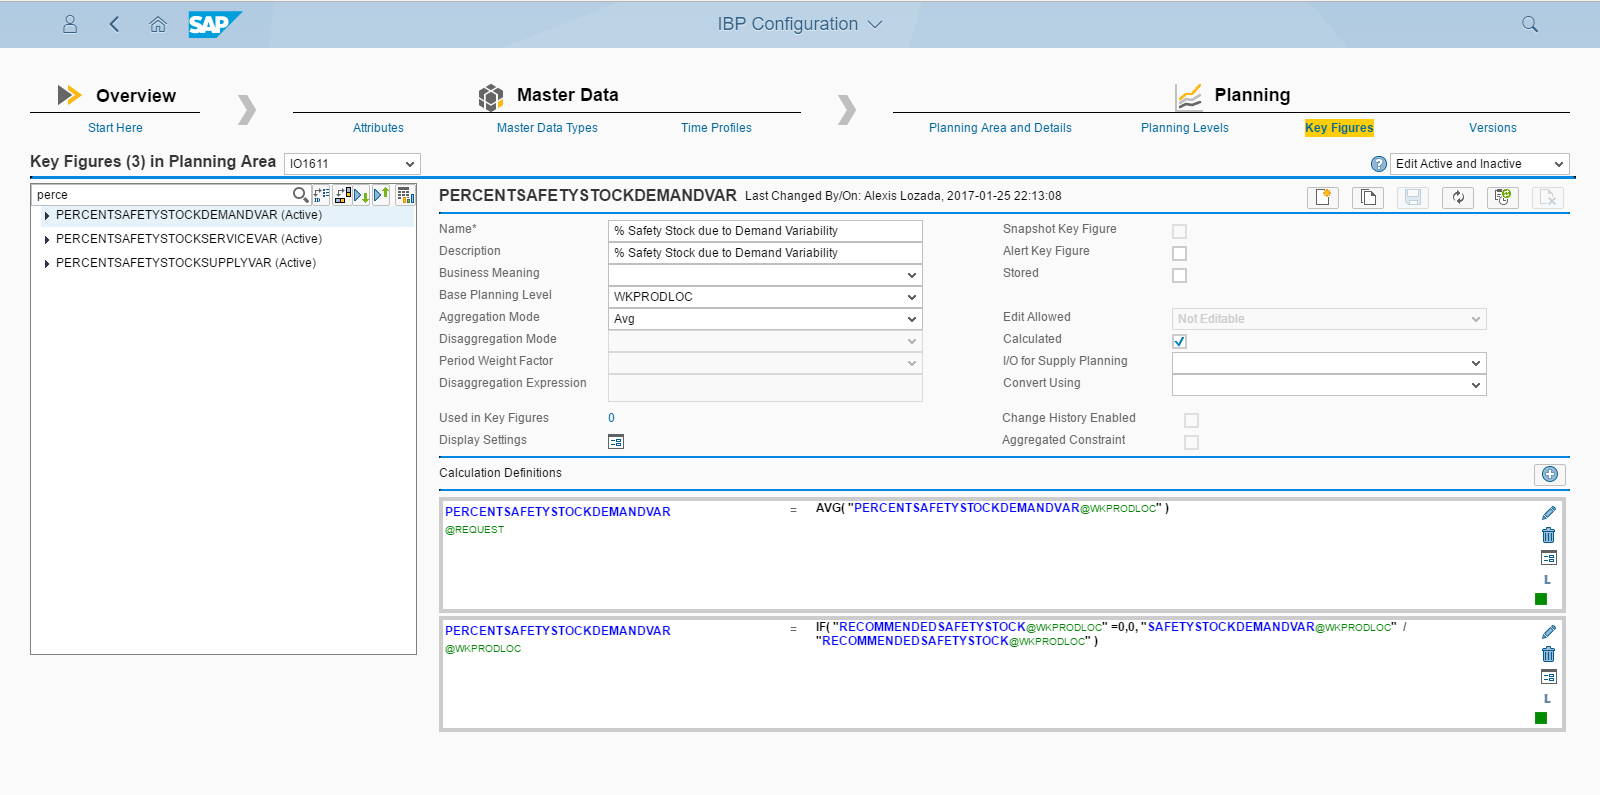
Figure 4 shows an example configuration of how to calculate the percentage value for output key figure Safety Stock due to Demand Variability (SAFETYSTOCKDEMANDVAR). The configuration divides SAFETYSTOCKDEMANDVAR by RECOMMENDEDSAFETYSTOCK. Creating the same configuration for output key figures Safety Stock due to Supply Variability (SAFETYSTOCKSUPPLYVAR) and Safety Stock due to Service Variability (SAFETYSTOCKSERVICEVAR) will allow users to chart an uncertainty index as shown in Figure 3 where users can visualize the percent contribution of each safety stock driver.
Figure 4
In addition to the three new output key figures, SAP IBP for inventory’s Global (Multistage) Inventory Optimization operator generate output key figure Safety Stock due to Zero Lot Size (SAFETYSTOCKLOTSIZE). This output key figure helps quantifying the impact of lot sizes in minimizing inventory driven by supply chain uncertainty (safety stock). The output key figure is calculated as the difference between calculated safety stock assuming zero lot size in the supply chain (S1) and recommended safety stock with the provided input lot size (S2). As a result, SAFETYSTOCKLOTSIZE = S1- S2.
In sum, supply chain planners can now identify what uncertainty variable drives safety stock in the supply chain and convert such information in continuous improvement projects that can minimize such uncertainty in the supply chain, resulting, consequently, in lower safety stock.
Constraint of Internal Service Levels to Upper/Lower Bounds
SAP IBP for inventory multi-stage inventory optimization calculates optimal internal service levels for internal nodes defined in the supply chain model. From an adoption of the multi-stage inventory planning results from SAP IBP for inventory, many users, who currently plan for inventory in single stages or not considering the end-to-end supply chain network, typically plan for internal service levels themselves, mirroring the service level downstream of the supply chain (This sentence was confusing for me – rephrase?). For example, inventory planners would likely target a service level for an internal product-location almost equal to the customer service level of such location to the customer demand. That is, they would plan for an internal service level of 98% if the downstream node’s customer service level equals to 98%. Seeing internal service levels from SAP IBP for inventory that can range from 50% to 80% represents a shift of paradigm for the inventory planners.
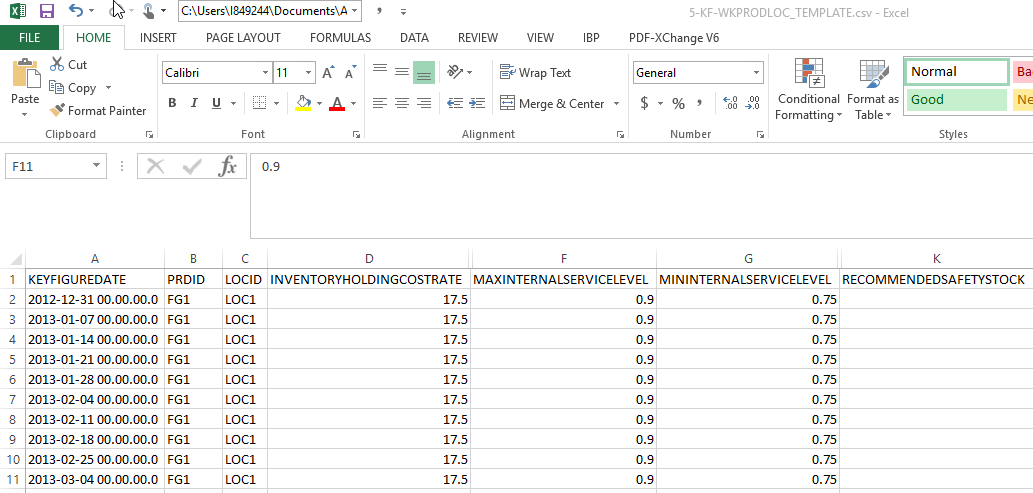
In IBP 1611, we released new input attribute as key figures that reside in the LOCATIONPRODUCT Master Data Type. Users can now apply input attribute as key figures MININTERNALSERVICELEVEL and MAXINTERNALSERVICELEVEL to set lower and upper limits to internal service levels for internal nodes in the supply chain. Users can now gradually adopt IBP for inventory’s Internal Service Level recommendations by choosing how they want to bound such output. In addition, the new input key figures can help users constrain flow of inventory between internal nodes of the supply chain by setting the bounds for the calculated Internal Service Level output key figure. Specifically, the Global (Multistage) Inventory Optimization operator reads the value of these key figures in the current week only. Figure 5 shows how you can set up the new input key figures in the LOCATONPRODUCT Master Data file.
Figure 5
 Safety stock calculation based on allocation policy for locations with direct and indirect demand
Commonly, supply chain networks include nodes (product-location combinations) that handle capacity constraint needs for product overflows temporarily (during key season periods) or permanently. Such nodes (product-location combinations) can service two types of demands, directly from users and indirectly from other nodes/locations of the supply chain, hence, the term “hybrid” nodes (product-location combinations).
In SAP IBP 1611, users can now decide how to allocate safety stock for “hybrid” nodes (product-location combinations). Before, SAP IBP for inventory allocated safety stock based on a First-Come-First-Serve policy, which accounted for risk pooling the variability of all demand streams. Now, users have the choice to select an allocation policy that most appropriately applies to business needs. At the product-location level, in addition to First-Come-First-Serve, users can select a Divide policy that treats each demand stream independently of one another when calculating safety stock (no risk pooling) or an Independent policy that only considers customer demand when calculating safety stock (see Figure 6).
Figure 6

Intuitively, higher safety stock will be allocated to a hybrid node with a Divide policy versus a First-Come-First-Serve policy due to the absence of risk pooling in the Divide policy. An Independent policy could have lower safety stock allocated versus a First-Come-First-Serve policy due to not considering the demand quantity from internal nodes.
Figure 7

SAP IBP for inventory handles the safety stock allocation policy through a safety stock policy indicator attribute in the LOCATIONPRODUCT Master Data Type called SAFETYSTOCKPOLICY with letters F, D or I (See Figure 7). If attribute is missing, SAP IBP for inventory will process safety stock allocation as First-Come-First Serve as default.
Overall, with these additions in SAP IBP 1611 release, SAP IBP for inventory has empowered users to seize the impact of uncertainty in safety stock, bound internal service levels to business applicable levels, and apply appropriate safety allocation policies to hybrid nodes.
