- SAP Community
- Products and Technology
- Enterprise Resource Planning
- ERP Blogs by SAP
- Get more insights: KPI 'Actual Scrap Rate (%)'
Enterprise Resource Planning Blogs by SAP
Get insights and updates about cloud ERP and RISE with SAP, SAP S/4HANA and SAP S/4HANA Cloud, and more enterprise management capabilities with SAP blog posts.
Turn on suggestions
Auto-suggest helps you quickly narrow down your search results by suggesting possible matches as you type.
Showing results for
Advisor
Options
- Subscribe to RSS Feed
- Mark as New
- Mark as Read
- Bookmark
- Subscribe
- Printer Friendly Page
- Report Inappropriate Content
2019 Feb 27
9:49 AM
6,053
- SAP Managed Tags:
- SAP Business ByDesign
One way to keep your production costs low - and your profitability high - is to take care about your scrap rate. Scrap rates measure the failed assemblies or production of an output product which cannot be restored in relation to the total. Reasons for scrapping can be exemplary poor raw or input materials, careless set up procedures, faulty machinery or ineffective production operators.
As a consequence, you might not produce enough goods to fulfill all customer orders and loose sales volume. Through checking on high scrap rates certain product or production group production managers can try to find the root causes for it and take the respective measures to overcome the negative impact.
The ‘Actual Scrap Rate (%)’ KPI sets the scrap quantity in relation to the total yield and scrap quantity.
The KPI 'Actual Scrap Rate (%) is now available in standard and you can immediately add it to the Launchpad or the Overview pages related to the Work Centers.
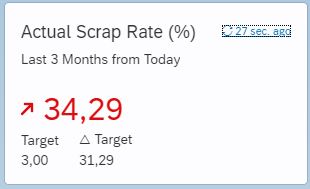
Following you see an adapted example to the standard version.
The standard KPI relates to the selection of Month to Date values and e.g. does not have a target set since it is different from company to company.

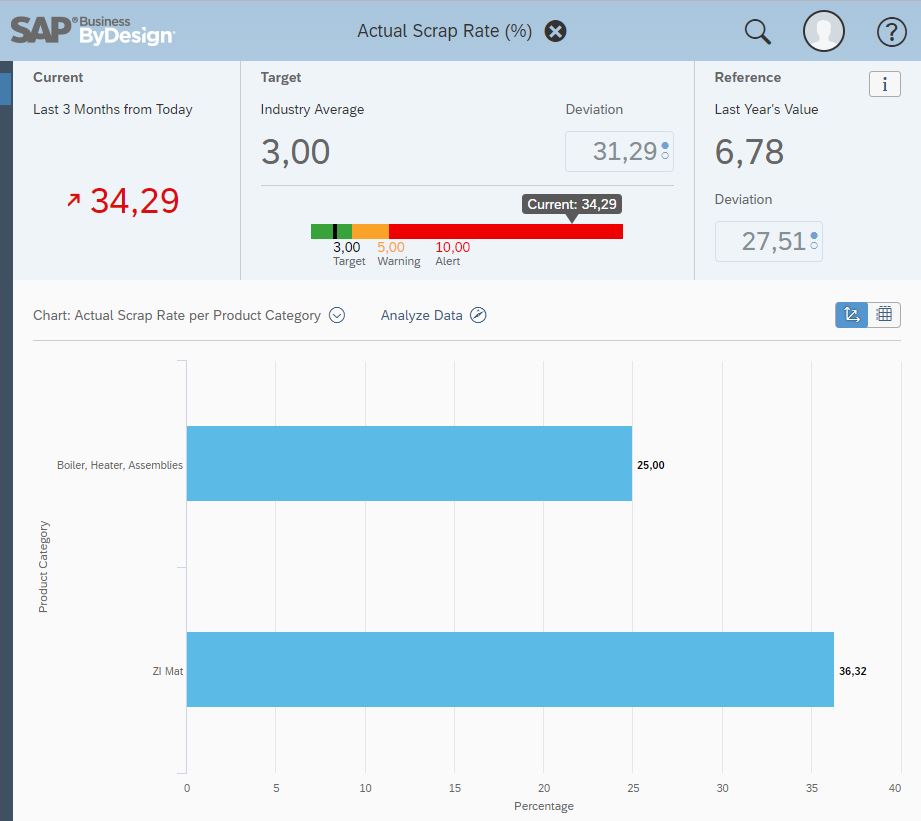
With a click on the tile, you get more details showing the alerting values, reference and a chart view.

A production manager can identify the product category with the highest scrap rate and start analyzing further from here.
With changing to the more detailed view, it shows the Year/Month, site and output product category along with the Actual Scrap quantity and the Yield Quantity.

Here we see that in the last two month the scrap rate was especially high and both product categories were affected.
With the Analyze Data Button, you can display all detailed data, for example drill down to the aspect of the output product or the production order. The Add Field functionality was used to include the product category which is derived from the product and the Year/Month display which is aggregated based on the production end date.

Set up of the KPI ‘Actual Scrap Rate (%)’:
The KPI is based on the “Yield and Scrap” standard report (SCMYASU01_Q0001) with the key figure Actual Scrap Percentage which you can find in the “Production Control” work center for production managers. In order to adapt the report views and selections for your needs you can do the changes in the “Business Analytics” work center in the Design Reports view.

In the Business Analytics work center under the Design KPI’s view, you can also create and change KPIs. In the following can you see the settings for the Actual Scrap Rate (%) KPI and how it was adapted:
a.) General Tab: Here you use the views and selections from the “Yield and Scrap” report such as the selection for the last 3 months from today. The calculation explanation of the key figure you find here.

b.) Values and Thresholds: Here we used fixed values for target and relative reference value related to last year.
For this example, the target is set to 3 (%), a warning is displayed over 5 (%) and alerts beyond 10 (%). You might want to adapt this to your needs.

c.) Additional Contexts: These are additional report views you want to display in the KPI.

d) Filter: If you want to use KPI Filters to create KPI variants, the site or product category might be useful.
This blog post is part of a series of blog posts introducing KPIs for process monitoring and optimization purposes Process Monitoring and Optimization KPI’s.
As a consequence, you might not produce enough goods to fulfill all customer orders and loose sales volume. Through checking on high scrap rates certain product or production group production managers can try to find the root causes for it and take the respective measures to overcome the negative impact.
The ‘Actual Scrap Rate (%)’ KPI sets the scrap quantity in relation to the total yield and scrap quantity.
The KPI 'Actual Scrap Rate (%) is now available in standard and you can immediately add it to the Launchpad or the Overview pages related to the Work Centers.
Following you see an adapted example to the standard version.
The standard KPI relates to the selection of Month to Date values and e.g. does not have a target set since it is different from company to company.

With a click on the tile, you get more details showing the alerting values, reference and a chart view.

A production manager can identify the product category with the highest scrap rate and start analyzing further from here.
With changing to the more detailed view, it shows the Year/Month, site and output product category along with the Actual Scrap quantity and the Yield Quantity.

Here we see that in the last two month the scrap rate was especially high and both product categories were affected.
With the Analyze Data Button, you can display all detailed data, for example drill down to the aspect of the output product or the production order. The Add Field functionality was used to include the product category which is derived from the product and the Year/Month display which is aggregated based on the production end date.

Set up of the KPI ‘Actual Scrap Rate (%)’:
The KPI is based on the “Yield and Scrap” standard report (SCMYASU01_Q0001) with the key figure Actual Scrap Percentage which you can find in the “Production Control” work center for production managers. In order to adapt the report views and selections for your needs you can do the changes in the “Business Analytics” work center in the Design Reports view.

In the Business Analytics work center under the Design KPI’s view, you can also create and change KPIs. In the following can you see the settings for the Actual Scrap Rate (%) KPI and how it was adapted:
a.) General Tab: Here you use the views and selections from the “Yield and Scrap” report such as the selection for the last 3 months from today. The calculation explanation of the key figure you find here.

b.) Values and Thresholds: Here we used fixed values for target and relative reference value related to last year.
For this example, the target is set to 3 (%), a warning is displayed over 5 (%) and alerts beyond 10 (%). You might want to adapt this to your needs.

c.) Additional Contexts: These are additional report views you want to display in the KPI.

d) Filter: If you want to use KPI Filters to create KPI variants, the site or product category might be useful.
This blog post is part of a series of blog posts introducing KPIs for process monitoring and optimization purposes Process Monitoring and Optimization KPI’s.
Labels:
You must be a registered user to add a comment. If you've already registered, sign in. Otherwise, register and sign in.
Labels in this area
-
API and Integration
1 -
Artificial Intelligence (AI)
1 -
Business Trends
361 -
Business Trends
79 -
Customer COE Basics and Fundamentals
1 -
Digital Transformation with Cloud ERP (DT)
1 -
Event Information
454 -
Event Information
65 -
Expert Insights
109 -
Expert Insights
449 -
General
2 -
Governance and Organization
1 -
Great Britain
1 -
Introduction
1 -
Life at SAP
408 -
Life at SAP
8 -
Product Updates
4,607 -
Product Updates
577 -
Roadmap and Strategy
1 -
Technology Updates
1,490 -
Technology Updates
230
Related Content
- SAP Sustainability Footprint Management: Q3-24 Updates & Highlights in Enterprise Resource Planning Blogs by SAP
- Post Discounting of Long-Term Asset and Liabilities in SAP S/4HANA Public Cloud in Enterprise Resource Planning Q&A
- SAP S/4HANA Cloud Private Edition | 2023 FPS02 Release – Part 1 in Enterprise Resource Planning Blogs by SAP
- SAP ISU - Meter to Cash in Enterprise Resource Planning Blogs by Members
- Advanced Available - to - Promise (aATP in S/4HANA) version 2023 in Enterprise Resource Planning Blogs by Members
Top kudoed authors
| User | Count |
|---|---|
| 8 | |
| 7 | |
| 5 | |
| 4 | |
| 4 | |
| 4 | |
| 3 | |
| 3 | |
| 2 | |
| 2 |