Get more insights into delivery performance: Uploa...
Enterprise Resource Planning Blogs by SAP
Get insights and updates about cloud ERP and RISE with SAP, SAP S/4HANA and SAP S/4HANA Cloud, and more enterprise management capabilities with SAP blog posts.
Warehouse Managers, Supply Planners or Sales Manager's need visibility into the current delivery performance. They need to be able to monitor the current status with regards to issues delivering requested quantities and delivery delays based on company goals.
The On-time in Full Delivery is a key performance indicator (OTIF KPI) to measure the delivery performance of the site or company. When drilling down into details, it can reveal the root cause for delivery problems or insights on how to work on corrective measures. For example, you might identify that a certain sales unit has an increased number of issues, a certain customer is facing the majority of delays or specific product causes delays in delivery.
This blog provides you with the required know how to setup, use and interpret the On Time In Full Delivery KPI and related report within SAP Business ByDesign built-in Analytics. You can later adapt KPI and Report - for example the threshold values - to your needs.
On Time in Full (OTIF) Delivery is a well-known KPI to analyze the supply chain process. On Time in Full means, that the company was able to deliver the full quantity requested by the customer on the requested date the latest. The OTIF can be measured for a complete order, meaning that all items of one sales order are delivered on-time and in full.
This KPI Is now available ready-to-use.
In the following some explanations and details for the interpretation:
How is the KPI calculated: If a sales order consists of multiple items and only one of the items is either partially delivered or not on time, the OTIF Delivery KPI for the complete sales order is 'not achieved' or = 0%, otherwise it is 'achieved' or = 100%.
As reference date and quantity in SAP Business ByDesign we will use the 'requested date' of the sales order item and the requested quantity and compare it with the delivered dates and quantities taken from the corresponding deliveries.
Based on the OTIF report you can track your overall delivery performance on a more aggregated level and further analyze the root cause of a bad KPI value by drilling down to the details, e.g. you can analyze the KPI on sales unit, customer, or product category level.
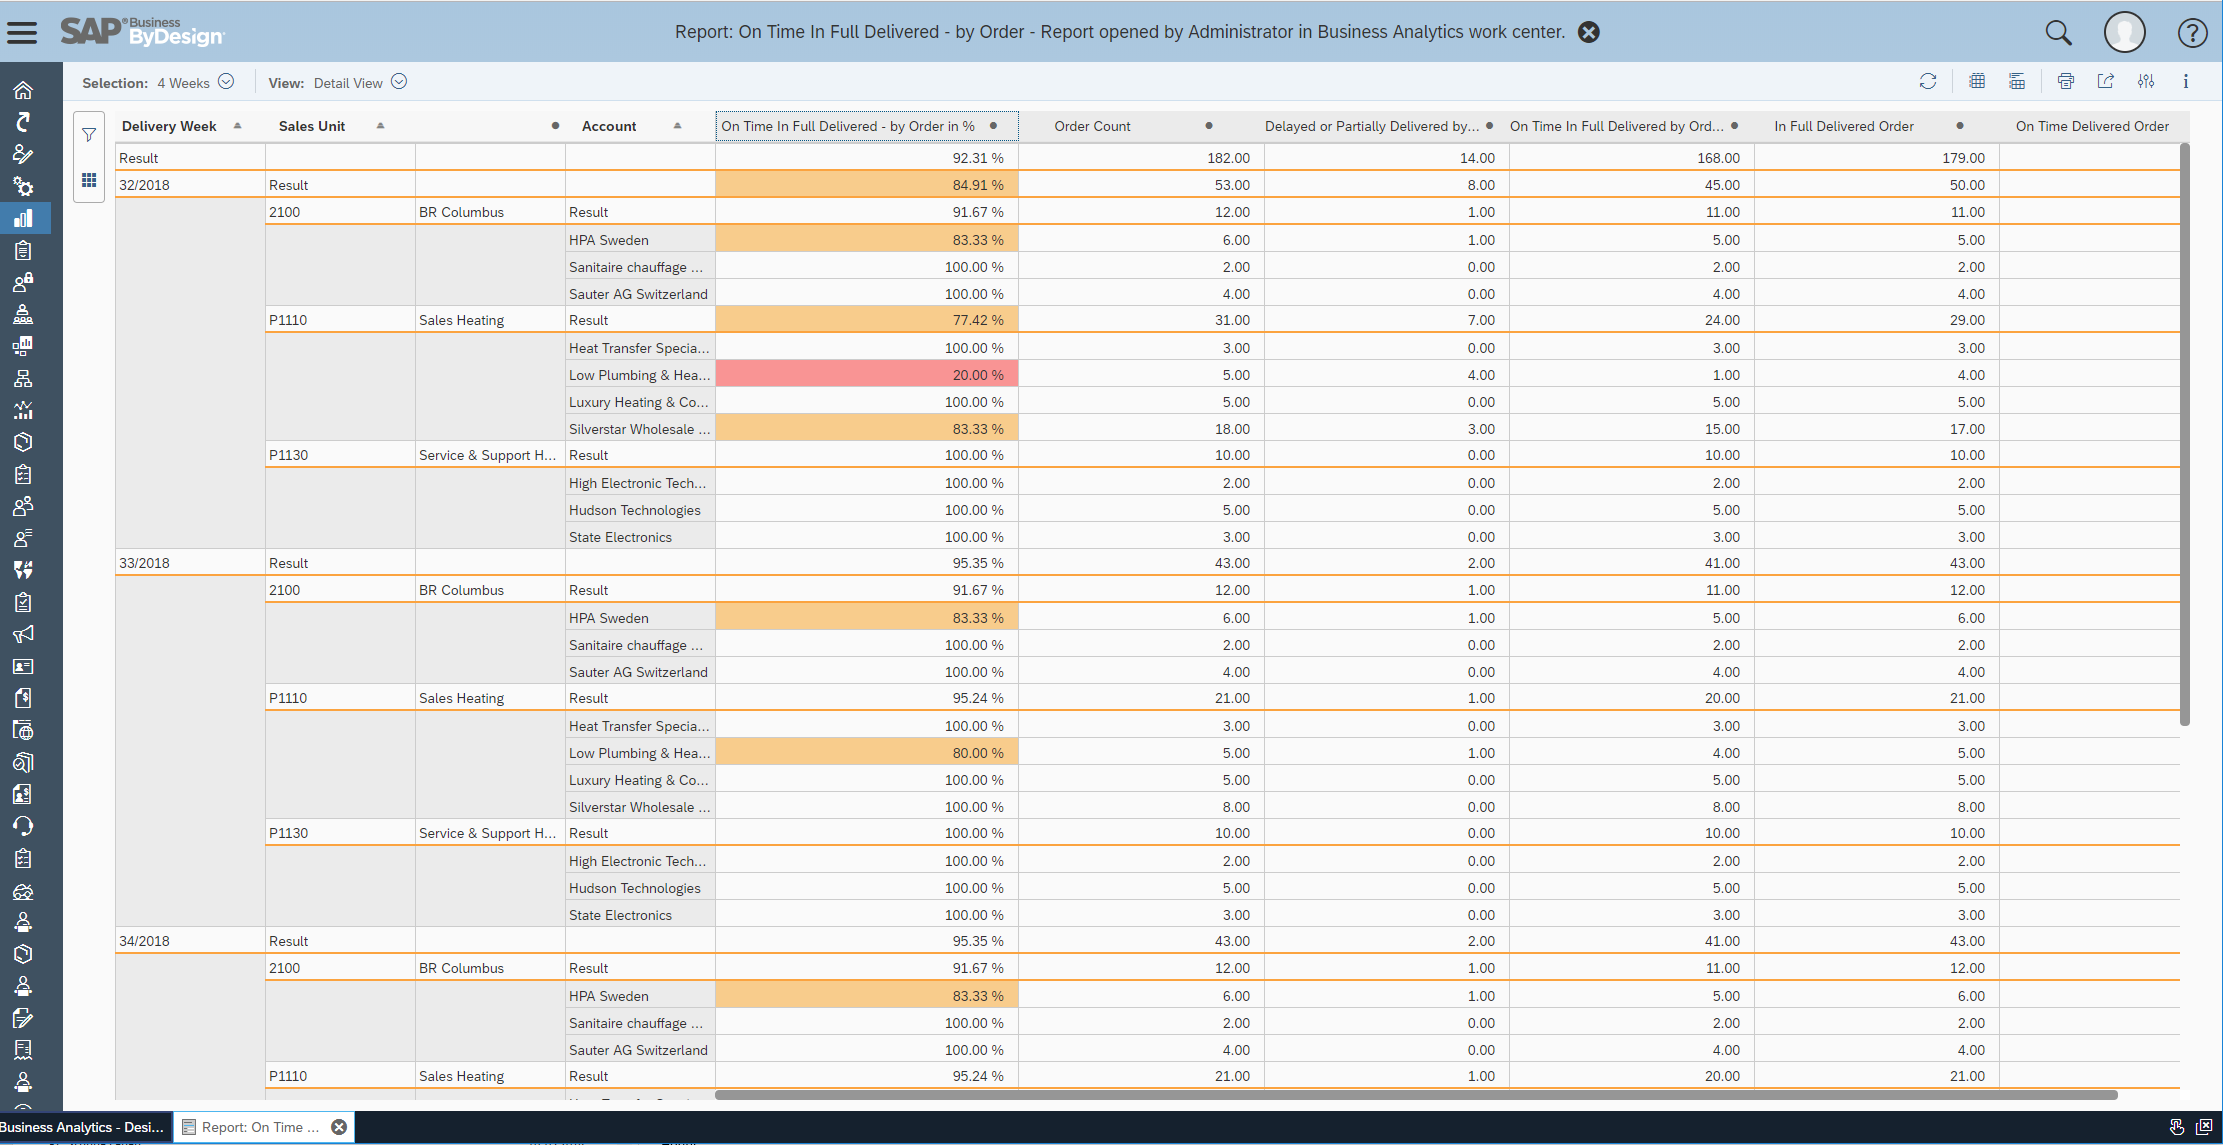
The Report looks as follows (drilled down to sales unit and account level):
The OTIF key figure is shown in the column 'On Time in Full Delivered By Order in %'. For the last 4 weeks, OTIF is aggregated over a total number of 182 sales orders (2nd Column: Order Count). 164 out of the 182 sales orders have been delivered on time and in full, which leads to an OTIF percentage of 92,31 %. 14 sales orders have been delivered delayed or partially (3rd key figure column Delayed or Partially Delivered). The 5th column 'In Full Delivered Order' shows more specifically the number of fully delivered orders - even if they were delayed. The 6th column 'On Time Delivered Order' displays orders delivered on time - even if they were only partially delivered.
Very low key figure values for On time in Full Delivered By Order in % are highlighted in orange or red.
In week 32/2018 in the sales unit P1100, the customer Low Plumbing & Heating got only one out of five sales orders delivered as requested. The last 2 columns are used best when drilling down to the characteristic sales order level.
Here we can find the following:
As we have seen before: One sales order of Low Plumbing & Heating was delivered in full and on time.
Additionally we can see that 3 of the sales orders were delivered in full, but too late. One sales order was delivered on time but only with a partial quantity.
The corresponding KPI looks as follows:
Experts can get more background information here:
The Key Figure On Time in Full Delivered - by Order in % (any results level) can be simply calculated by the other Key Figures (on same level) On Time In Full Delivered by Order/Order Count *100
The Key Figure On Time in Full Delivered - by Order in % (highest results level) cannot be simply calculated by the average of the sub-results (e.g. weeks) due to the fact that a Sales order might be delivered in several deliveries shipped in several weeks that were not on time, but the sales order is only counted once as delivered not on time.
Be aware that this report's anchor point is the outbound delivery. And a sales order only shows up once at least one outbound delivery was created. The outbound delivery data is compared to the requested data from the sales order and is evaluated.
That might result in a situation that the Key Figure On Time in Full Delivered - by Order in % for a sales order is shown in one week as 100% ok and in another week as not o.k. This happens for example for a sales order with 2 items: one item was delivered in full and in time and the other item was delivered late. In total (without selecting the week), the sales order is counted only once as not o.k.
This might result in a situation that the Key Figure On Time in Full Delivered - by Order in % for a sales order is shown in one week as not ok. This happens if a sales order was partially delivered in one week and the rest delayed in another week. Also here, in total, the sales order is counted only once as not o.k.
We measure it based on the Sales Order requested dates/quantities in relation to the delivery dates and quantities. If you want you can consistently adapt the key figures to confirmed dates or promised dates accordingly.
The sample selection is based on a relative select of the last 4 calendar weeks excluding the current calendar week.
More Insights for analytical experts you can find in this video
It might also make sense to measure the On Time in Full for individual items of a sales order. The respective key figures have to be created in a similar way.
herzlichen Dank für die ausführlichen Erläuterungen! Wirklich toll zu sehen, was alles möglich ist.
Wir haben folgende Anforderung:
Bei uns bestehen rd. 50% der erfassten Aufträge aus mehr als einer Lieferung. D.h. Der Kunde bestellt möglicherweise das gleiche Produkt zur Lieferung an unterschiedlichen Zeitpunkten. Hierfür legen wir also nicht für jede Lieferung einen eigenen Kundenauftrag an, sondern erfassen einfach weitere Positionen zu unterschiedlichen Wunschlieferterminen. Dadurch wird im System eine neue Liefergruppe gebildet.
Es könnte dann wie folgt aussehen:
100 x Produkt A - Wunschliefertermin: 15.03.2019 - Liefergruppe 1
150 x Produkt B - Wunschliefertermin: 15.03.2019 - Liefergruppe 1
100 x Produkt C - Wunschliefertermin: 15.03.2019 - Liefergruppe 1
100 x Produkt A - Wunschliefertermin: 15.05.2019 - Liefergruppe 2
50 x Produkt C - Wunschliefertermin: 15.05.2019 - Liefergruppe 2
200 x Produkt D - Wunschliefertermin: 15.05.2019 - Liefergruppe 2
120 x Produkt B - Wunschliefertermin: 15.07.2019 - Liefergruppe 3
60 x Produkt D - Wunschliefertermin: 15.07.2019 - Liefergruppe 3
Stand heute würde dieser Auftrag mit OTIF 0% gewertet werden - auch und obwohl - wir in der Lage waren jede Liefergruppe für sich zum gewünschten Termin an den Kunden zu liefern. Insofern ist der aktuelle OTIF Bericht für uns nur sehr eingeschränkt nutzbar, da er kein verlässliches Ergebnis liefert. Er würde nur ein verlässliches Ergebnis liefern, wenn der Kunde nur eine Lieferung zu einem Wunschlieferdatum erhält.
Ich habe nun bereits etwas herumexperimentiert. Allerdings ist mir kein sinnvoller Weg eingefallen wie sich diese Anforderung umsetzen lässt. Können Sie hier behilflich sein?
I am working on an OTIF KPI based on sales order item level. I plan to publish this also in a blog in the next couple of weeks.
If you want to adapt it by yourself, here the approach I am following:
Basically, I created a new report and similar key figures as for the OTIF on sales order basis. I will replace the key figure order count by the order item count and adapt the dependent key figures accordingly. In addition, in every key figure which had an Exception Aggregation, I replaced the Charateristic ‘Order ID’ by ‘Line Item UUID’.
I think this should cover the need expressed by your example although it does not consider the delivery groups - but it considers each item separately.
this blog is related to SAP Business ByDesign. With regards to the OTIF definition, I tried to describe above everything what we used to calculate it (requested and actual delivery dates, requested and actual delivered quantities). If you have a concrete question, I am happy to answer it.
Although, the business background is same independent from all systems, it differently applies on each system. So, it is not ready-to-use for SAP S/4HANA.
There are two Delivery Performance KPI’s which look as if it is going into the same direction. For more details for S/4 HANA, please refer to the respective documentation of S/4 HANA. You can try searching for 'Delivery Performance'.
It is indeed a great KPI for us for which we were looking for a long time.
Could you please confirm that we can also use it with POs (Purchase Orders) and not only SOs (Sales orders) ? It is because we need to monitor performance of our suppliers with this KPI.
currently, we do not offer 'Supplier Delivery Evaluation' out of the box as we do on the customer side.
You can check the delivery reliability report - it has already much information on dates and quantities.
In case it is not sufficient, I would like to invite you to create an improvement request on our influencing platform in for the Supplier Relationship Management Area.
Very good blog and really required for any Customer driven Business. Could you please share if we have any such Analytical App that is introduced in S4 HANA Cloud that offer this OTIF KPI reports.
Thank you for this detailed information. I have to say that my customer's are much more interested in performance to promise (the original atp date) than performance to request. They want to measure how well they are meeting their commitments. I hope SAP will recognize and address this someday.
you can define the OTIF KPI based on the promised date on your own with analytical key user means.
You can check the video for details. The key figure settings are explained. If you replace the requested date by the promised date respectively, you could build the key figures to your needs.
If you have a reference system (not older than mid 2018) you can also find the key figures there.
Thank you Iris. Unfortunately, I don't think this helps. We are looking for the original promise date. For example, the customer was first promised an item would ship next month, but time goes by, there are delays, and the sales order subsequently gets updated with a new promise date for shipment 3 months from now. That original promise date has disappeared and it looks like our performance is great, because we are not reporting that original promise date, we are reporting on performance against the new promised date.
the confirmation date gets updated with each confirmation run - if there are delays.
But the 1st confirmation date to the customer is stored in the promised date, which does not change over time. You can verify this in the underlying data source of the 'outbound delivery performance' where the expected promised date is captured. You only see the promised date in the data source, but not in the sales order.
Please check it in your system again.
Best regards,
Iris
You must be a registered user to add a comment. If you've already registered, sign in. Otherwise, register and sign in.