
- SAP Community
- Products and Technology
- Enterprise Resource Planning
- ERP Blogs by Members
- SAP S/4 HANA 1809 Quality Management Analytical Ap...
Enterprise Resource Planning Blogs by Members
Gain new perspectives and knowledge about enterprise resource planning in blog posts from community members. Share your own comments and ERP insights today!
Turn on suggestions
Auto-suggest helps you quickly narrow down your search results by suggesting possible matches as you type.
Showing results for
former_member62
Explorer
Options
- Subscribe to RSS Feed
- Mark as New
- Mark as Read
- Bookmark
- Subscribe
- Printer Friendly Page
- Report Inappropriate Content
10-03-2019
11:46 PM
Introduction
This blog post provides an overview of the new analytical apps available in SAP S/4 HANA 1809 for Quality Management module. The Quality Assurance business function is an integral part of a company which is pivotal in ensuring that the product is of optimum quality. To ensure this it is necessary to have correct information about the performance of the material in the right form. To know the trends of the material at each stage. In a nutshell the right representation of data related to a material plays a key part in the quality assurance business function to analyze the route cause of a failure and take measures to avoid it in future which would save rework costs. The new quality management analytical apps provide the perfect blend of graphical representation of data and the key statistics which would help tracking the performance based on material, supplier, customer, time series, calendar year,etc. This would enable the QA manager to have a clear visibility of data and also be able to present it in front of a wider forum in the desired manner thus ensuring a 360 degree view of the data.
Analytical Apps
Manage Control Charts
This app enables to display and manage control charts as per the Statistical Process Control (SPC) criteria. It gives a graphical representation of the characteristics and gives a comparison of the measured values and the action limits thus assisting in detecting the deviation.

The charts can filtered and selected on the basis of SPC criteria, master inspection characteristics, material , plant, work center, chart type, etc. The action limit Violations by period are displayed in a graphical format.

Click on the one of the violation graph entry for a specific period, the particular control chart entry is displayed. Now click on the control chart

It is displayed, as graphical representation of the control variable against the results recorded on dates based on the period selected, along with the Upper and Lower Action and Warning Limits. Now, click on calculate and activate, then the process capability index values ( Cp and Cpk) are calculated along with the partial samples and No. of individual values.

The standard deviation data is displayed as per the calculations.

The statistical information is displayed as per the calculation.

The Bill of operations, characteristic information is displayed including results, valuation and status as applicable. At the end the administrative data is displayed.

Display Results History
This app displays the results history for a master inspection characteristic and also displays it based on the characteristic number in the inspection plan. Thus it shows a graphical representation of the valuation of a characteristic, thus enabling a comparison of results.

The aggregation level of the results can be based on the master inspection characteristics or the inspection characteristics number in the inspection plan. It can be further filtered based on Bill of operations type ( routing, inspection plan, etc.), operation number, inspection characteristic number, plant of master inspection characteristic, created on etc. with further aggregation of inspection results based on inspection type, inspection lot origin, etc.
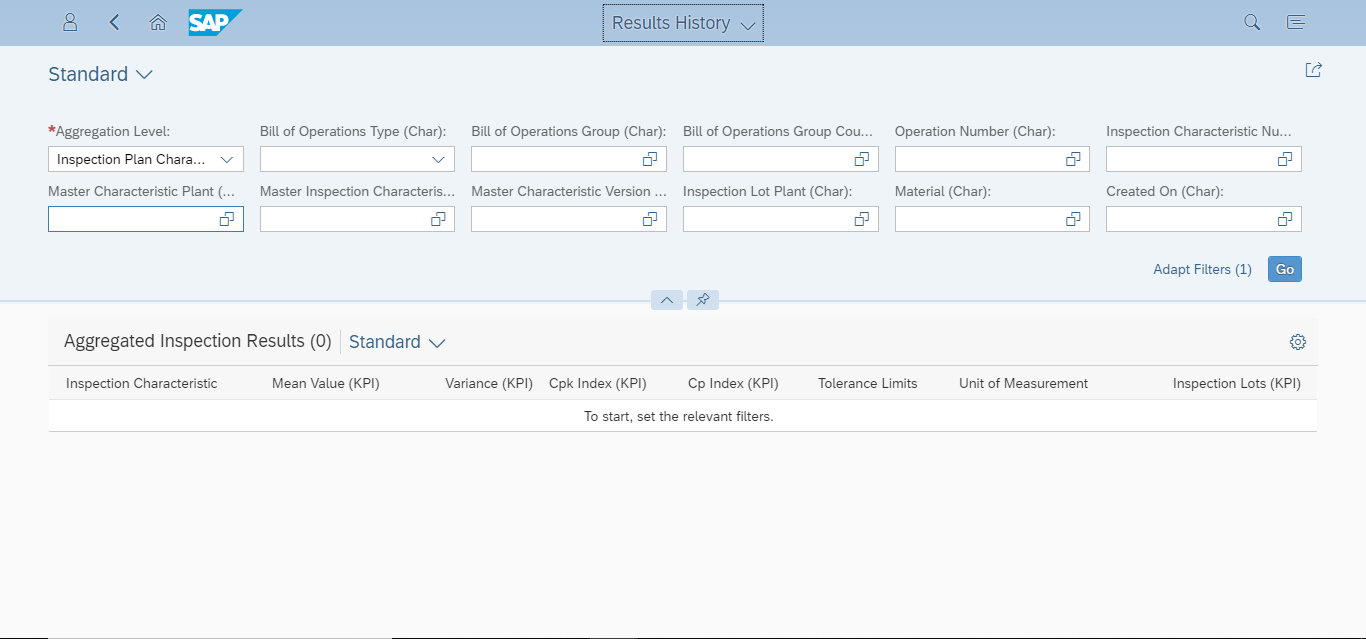
The aggregated inspection results consist of Key Performance Indicators (KPIs) like Mean value, Variance, Process capability indices (Cp and Cpk), tolerance limits, unit of measurement and number of inspection lots.

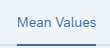
The KPIs of the characteristics are displayed at the top

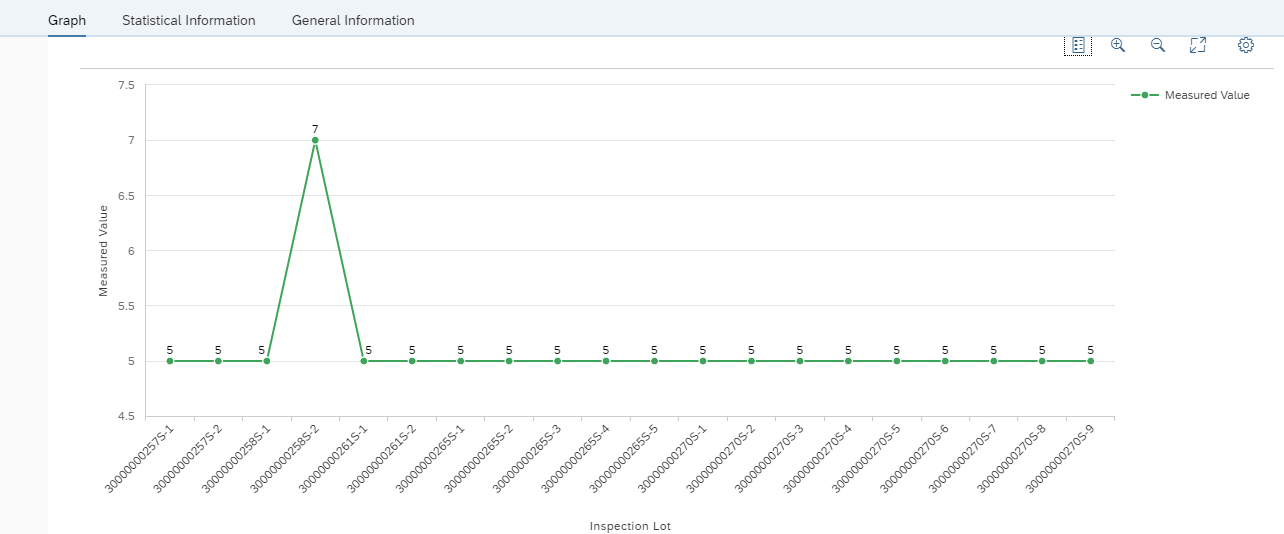
It can be view based on either mean values or single values.
The mean values of the results recorded against the inspection lot along with the upper and lower limit are displayed.


The values measured against each serial number or inspected unit in the inspection lot are displayed.

The Statistical information like process capability indices (Cp and Cpk), inspection specification and inspection result are displayed along with the general information like inspection sample size, bill of operations Type, group and counter.

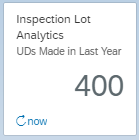
Inspection Lot Analytics
This app calculates the number of inspection lots having usage decisions which were made in the last one year. The analysis can be made based on the lots accepted and rejected by Time series, inspection type, material and plant. Also, lots skipped and not skipped can be viewed by time series, inspection type, material and plant.
The number of accepted and rejected lots are displayed by time series along with the rejection rate (%) mentioned against them. The rejection rate is calculated only on the basis of no. of accepted and rejected lots only, it does not consider skipped lots.

You can click on the chart for a specific period, where a pop-up appears having options to switch the selection based on other parameters such as inspection type, material and plant, etc.

The graph displays data based on selection option chosen for that specific period i.e. based on inspection type and for the month of February in this example.

Similarly, the data can be viewed based on other selection criteria like Lots Skipped and not skipped by time series, inspection type, material and plant.
In-addition to this there is also an option of mini charts, which display detailed information in graphical format when clicked on.
Click on the button
 to view them.
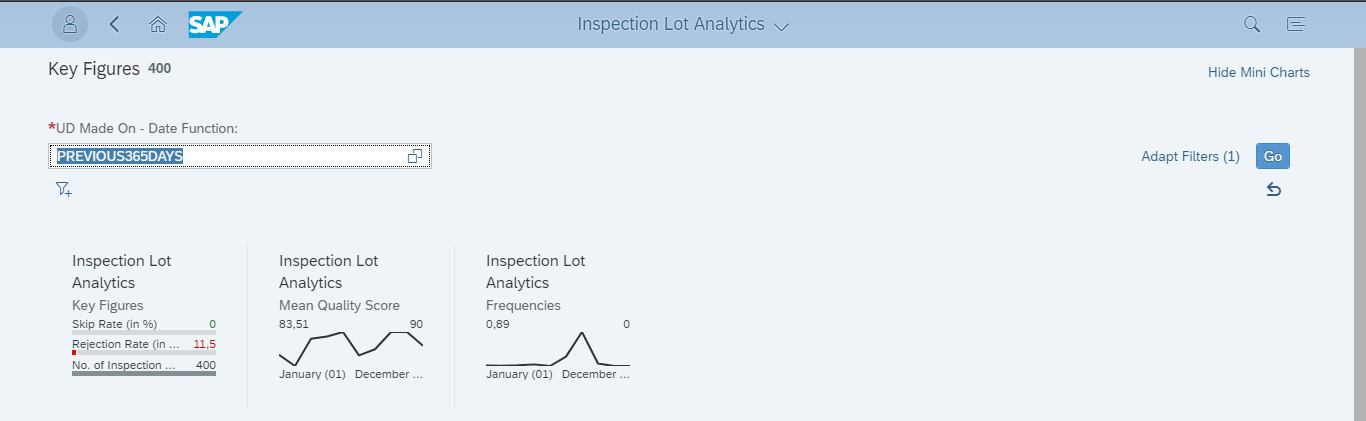
The chart is visible completely upon clicking on the mini chart, in this example it is for Mean Quality Score by Time Series. It can also filtered based on inspection type, material, plant, supplier and customer.

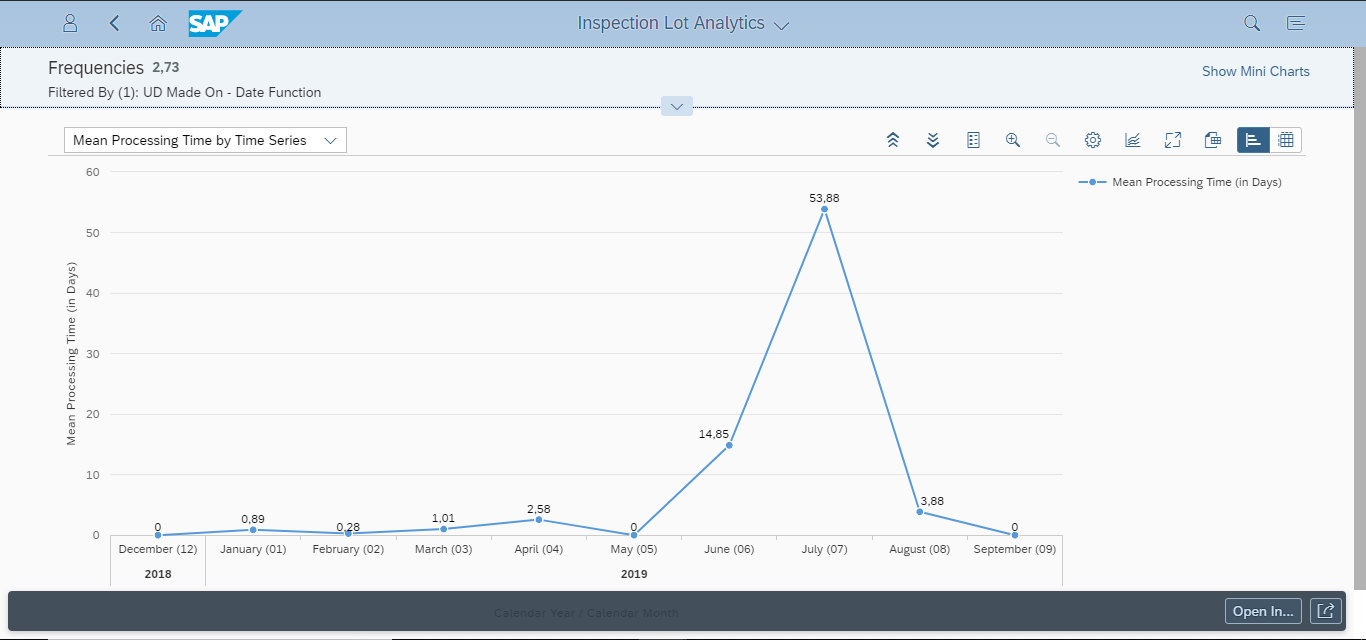
Similarly, the mini chart can be viewed based on frequencies against time series, inspection type and plant.
Additional Features
In- addition to the features mentioned above, there is a navigation option available which enables users to navigate further to relevant apps based on the available options as mentioned in the Fiori apps library. In this example, Inspection Lot Detailed Analytics and Manage Inspection Lots are available, subject to configuration done in Fiori side with reference to the steps mentioned in the Fiori Apps library.

Inspection Lot Detailed Analytics
This app, the inspection lots having usage decisions made can be analyzed on the basis of accepted and rejected lots, rejection rate, skip rate, total number of lots, skip lots and mean processing time based on time series, inspection type, material , plant, supplier and customer. The analysis steps can be added based on the above mentioned parameters and can be saved for further references.

The main filter criteria is the date function, primarily being the inspection lots with usage decisions being made in the last one year.

Now click on the button
 to begin the analysis.
The data can be further segregated based on the following filter criteria.

In this example, the lots are further segregated on the basis Accepted and Rejected lots which an be filtered on the basis of the options mentioned below.


The relevant option can be selected and then the graph is displayed, in this case the accepted and rejected lots are filtered by time series. Similarly, the lots can be filtered by inspection type, plant, material, supplier, customer, calendar year, etc.

Similarly, the top 10 materials with most accepted lots can be viewed. Similarly, the top ten plants with most accepted/ fewest accepted lots can be viewed. Also, top ten materials, suppliers, customers can be viewed based on most/ fewest accepted/ rejected lots.

Similarly, the lots can be viewed based on rejection rate, Skip rate, lots skipped and not skipped, total no. of lots, mean processing time and quality score, with further filtering based on time series, inspection type, material, plant, supplier, customer, calendar year and month/ quarter/ week. Apart from this the top ten entries for each parameter can be viewed categorized by highest and lowest values.
In this case the top ten plants with Highest Mean Quality Score are shown.

Additional Features
Apart from the above mentioned features, there is a navigation option available, in this app the navigation is possible with the Manage Inspection Lots, Characteristics Detailed Analytics and Characteristics Analytics as mentioned in Fiori Apps library, subject to configuration and target mapping done in Fiori side.

Characteristics Analytics
This app calculates the number of inspections based on the results recorded in the past one year. Characteristics can be analyzed with reference to the results recorded against them based on time, master inspection characteristics, inspection characteristics in the inspection plan, material, plant and work center.

The accepted/ rejected inspections can be viewed by time series with the corresponding rejection rate mentioned against them.

Similarly, the accepted/ rejected inspections can be viewed based on master inspection characteristics with the rejection rate mentioned against them. They can also be viewed by material, plant and Work center.

Similarly, inspections skipped/ not skipped, inspected and non-conforming units can be viewed on the basis of time series, master inspection characteristics, inspection characteristics in inspection plan, material, plant and work center.
Mini Charts
The mini charts feature is available which shows summarized parameter values along with detailed graphs upon clicking them. Click on the
 to view the available mini charts.
In this case the quantitative characteristics mini chart is displayed based on the over and under value tolerance by time series. It can also be filtered based on over/ under value tolerance by inspection characteristics in inspection plan, master inspection characteristics material, plant and work center.

It can also be viewed based on Mean value by inspection characteristics/ master inspection characteristics, Standard deviation, Process capability indices (Cp and Cpk) values by inspection characteristics/ master inspection characteristics.
In this case the standard deviation, Cp and Cpk values are viewed by master inspection characteristics.

Additional Features
Along with the above mentioned features, this app also has a navigation available. This app allows navigation to the characteristics detailed analytics app as mention in Fiori apps library subject to configuration and target mapping done in Fiori side.

Characteristic Detailed Analytics
The inspection characteristics can be analyzed with this app which have results recorded against them for different categories like accepted and rejected inspections, rejection rate, skip rate, mean value, standard deviation, process capability indices (Cp and Cpk), etc. based on time series, inspection characteristics, master inspection characteristics, work center, plant, material , supplier and customer.

The main filter criteria is based on the results recorded for the last one year.

Now, click on the button

The charts can be viewed based on the following categories


Once the initial selection parameter is chosen, then it can be further classified as per the options given below.


In this case the Accepted/ Rejected inspections are viewed by master inspection characteristics.

Similarly, they can be viewed based on time series, inspection type, work center, plant, material supplier, customer and calendar year, etc. Also, the top 10 parameters can be viewed for the most/ fewest accepted/ rejected inspections, rejection rate, skip rate, skipped and not skipped inspections, etc. as per the options mentioned above.
This example shows the top 10 master inspection characteristics with the highest Cpk Index.

The analysis step can saved so that it can used for future references

Additional Features
Along with the features mentioned above, there is also a navigation option available, in this case it can navigate Display results history app as mentioned in Fiori Apps Library subject to configuration and target mapping done in Fiori side.

Quality Technician Overview
This app shows several analytical cards in a single page, with a summarized information about inspection lots without inspection plans, with open results recording/ no inspection points, open results for inspection points, open tasks, etc.

Now, click on the desired analytical card, this allows navigation to the subsequent details screen.

In this case, the inspection lots with open results analytical card is clicked, which navigates to the record inspection results app. This app shows the progress of characteristics, operations and operation completion. The results can be recorded for multiple open lots together or individually.

The navigation is subject to the related apps mentioned in the Fiori apps library and the configuration and target mapping done in the Fiori side.
Additional Features
In addition to the features mentioned above, it is also possible to modify the analytical page by adjusting the sequence of the cards, hide a card, create a variant, updating filters using the adapt filter functionality and displaying the analytical cards information accordingly.
Quality Engineer Overview
This app shows, analytical cards with the summary of data like inspection lots without inspection plan, inspection lots without usage decisions, tasks by processor assignments, tasks by planned end date, action limit violations by work center, etc.

Click on the relevant cards, then it navigates to the subsequent screen
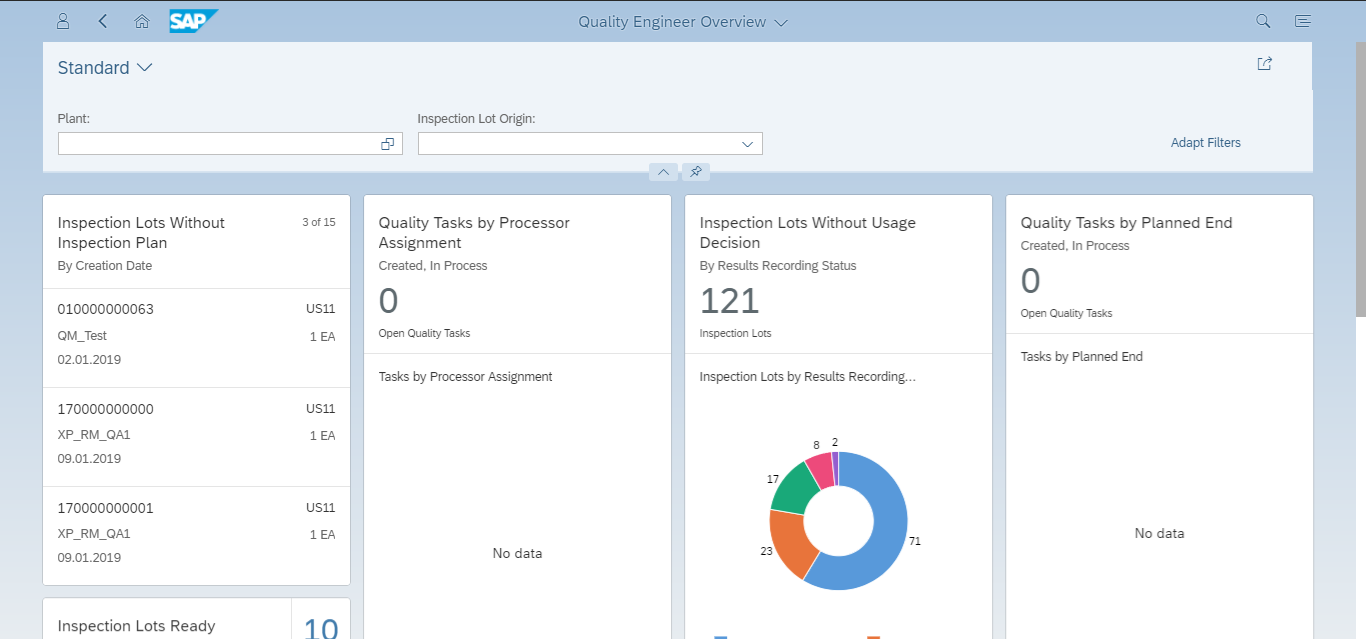
In this case the Inspection lots without usage decision card is selected by clicking on the relevant section on the pie chart ( Not Started, In-process, Completed with Violations, Completed and Not Required). The navigation is to the manage usage decision chart subject to the related the apps mentioned in the fiori apps library and the target mapping and configuration done in the fiori side.
Subsequently the relevant line can be selected and the usage decision can be made.

Additional Features
Apart from the features mentioned above, the analytical cards can also be modified like the position can be rearranged, the cards can be hidden, etc.
Conclusion
The Analytical apps play a key part in viewing and representing the QM data in the desired format accurately, enabling a clear visualization of the statistics allowing the users to slice and dice the data which results in accurate and crystal clear reporting leading to high quality assurance.
References
Manage Control Charts
https://fioriappslibrary.hana.ondemand.com/sap/fix/externalViewer/#/detail/Apps('F2810')/S15OP
Display Results History
https://fioriappslibrary.hana.ondemand.com/sap/fix/externalViewer/#/detail/Apps('F2428')/S15OP
Inspection Lot Analytics
https://fioriappslibrary.hana.ondemand.com/sap/fix/externalViewer/#/detail/Apps('F3239')/S15OP
Inspection Lot Detailed Analytics
https://fioriappslibrary.hana.ondemand.com/sap/fix/externalViewer/#/detail/Apps('F3273')/S15OP
Characteristic Analytics
https://fioriappslibrary.hana.ondemand.com/sap/fix/externalViewer/#/detail/Apps('F3383')/S15OP
Characteristic Detailed Analytics
https://fioriappslibrary.hana.ondemand.com/sap/fix/externalViewer/#/detail/Apps('F3382')/S15OP
Quality Technician Overview
https://fioriappslibrary.hana.ondemand.com/sap/fix/externalViewer/#/detail/Apps('F2361')/S15OP
Quality Engineer Overview
https://fioriappslibrary.hana.ondemand.com/sap/fix/externalViewer/#/detail/Apps('F2361')/S15OP
Fiori/ UI5 Consultant
Akshara Shrinivas
- SAP Managed Tags:
- PLM Quality Management (QM)
3 Comments
You must be a registered user to add a comment. If you've already registered, sign in. Otherwise, register and sign in.
Labels in this area
-
"mm02"
1 -
A_PurchaseOrderItem additional fields
1 -
ABAP
2 -
abap cds
1 -
ABAP CDS Views
2 -
ABAP CDS Views - BW Extraction
1 -
ABAP CDS Views - CDC (Change Data Capture)
1 -
ABAP Development
1 -
ABAP Extensibility
1 -
ABAP Programming
1 -
abapGit
1 -
ACCOSTRATE
1 -
ACDOCP
1 -
Adding your country in SPRO - Project Administration
1 -
Advance Return Management
1 -
AI and RPA in SAP Upgrades
1 -
API and Integration
1 -
Approval Workflows
1 -
Ariba
1 -
ARM
1 -
ASN
1 -
Asset Management
1 -
Associations in CDS Views
1 -
auditlog
1 -
Authorization
1 -
Availability date
1 -
Azure Center for SAP Solutions
1 -
AzureSentinel
2 -
Bank
1 -
BAPI_SALESORDER_CREATEFROMDAT2
1 -
Billing
1 -
BRF+
1 -
BRFPLUS
1 -
Bundled Cloud Services
1 -
business participation
1 -
Business Processes
1 -
CAPM
1 -
Carbon
1 -
CDS Annotations
1 -
Cental Finance
1 -
CFIN
1 -
CFIN Document Splitting
1 -
Cloud ALM
1 -
Cloud Integration
1 -
COGS SPLIT
1 -
condition contract management
1 -
Connection - The default connection string cannot be used.
1 -
Consignment Process using MRP Area
1 -
Custom Table Creation
1 -
Customer Screen in Production Order
1 -
Customizing
1 -
Data Quality Management
1 -
Date required
1 -
Decisions
1 -
desafios4hana
1 -
Developing with SAP Integration Suite
3 -
Direct Outbound Delivery
1 -
DMOVE2S4
1 -
DTW
1 -
EAM
1 -
EDI
3 -
EDI 850
1 -
EDI 856
1 -
edocument
1 -
EHS Product Structure
1 -
Emergency Access Management
1 -
Employee Central Integration (Inc. EC APIs)
1 -
Energy
1 -
EPC
1 -
Financial Operations
1 -
Find
1 -
FINSSKF
1 -
Fiori
1 -
FIORI MY-INBOX
1 -
Flexible Workflow
1 -
Gas
1 -
Gen AI enabled SAP Upgrades
1 -
General
1 -
generate_xlsx_file
1 -
Getting Started
1 -
HomogeneousDMO
1 -
How to add new Fields in the Selection Screen Parameter in FBL1H Tcode
1 -
IDOC
2 -
Integration
1 -
Learning Content
2 -
Ledger Combinations in SAP
1 -
LogicApps
2 -
low touchproject
1 -
Maintenance
1 -
management
1 -
Material creation
1 -
Material Management
1 -
MD04
1 -
MD61
1 -
methodology
1 -
Microsoft
2 -
MicrosoftSentinel
2 -
Migration
1 -
Migration Cockpit
1 -
mm purchasing
1 -
MRP
1 -
MS Teams
3 -
MT940
1 -
Newcomer
1 -
Notifications
1 -
Oil
1 -
open connectors
1 -
Order Change Log
1 -
ORDERS
2 -
OSS Note 390635
1 -
outbound delivery
1 -
outsourcing
1 -
PCE
1 -
Permit to Work
1 -
PIR Consumption Mode
1 -
PIR's
1 -
PIRs
1 -
PIRs Consumption
1 -
PIRs Reduction
1 -
Plan Independent Requirement
1 -
POSTMAN
1 -
poultry in s4hana
1 -
Premium Plus
1 -
pricing
1 -
Primavera P6
1 -
Process Excellence
1 -
Process Management
1 -
Process Order Change Log
1 -
Process purchase requisitions
1 -
Product Information
1 -
Production Order Change Log
1 -
Purchase Blanket Agreement
1 -
purchase order
1 -
Purchase requisition
1 -
Purchasing Lead Time
1 -
QUERY SQL
1 -
Query View
1 -
Redwood for SAP Job execution Setup
1 -
RISE with SAP
1 -
RisewithSAP
1 -
Rizing
1 -
S4 Cost Center Planning
1 -
S4 HANA
1 -
s4 hana public cloud
1 -
S4Hana
3 -
S4HANA Private Cloud
1 -
S4HANACloud audit
1 -
Sales and Distribution
1 -
Sales Commission
1 -
sales order
1 -
SAP
2 -
SAP Basis
1 -
SAP Best Practices
1 -
SAP Build
1 -
SAP Build Apps
1 -
SAP Business One
2 -
SAP Business One Service Layer
1 -
SAP CI
1 -
SAP Cloud ALM
1 -
SAP Cloud Integration
1 -
SAP CPI
1 -
SAP CPI (Cloud Platform Integration)
1 -
SAP Data Quality Management
1 -
SAP ECC
1 -
SAP ERP
2 -
SAP Maintenance resource scheduling
2 -
SAP MDM
1 -
SAP Mentors
1 -
SAP MM
1 -
SAP Note 390635
1 -
SAP S4HANA
2 -
SAP S4HANA Cloud private edition
1 -
SAP S4HANA Public Cloud Finance
1 -
sap security
1 -
SAP Subcontracting Process
1 -
SAP Upgrade Automation
1 -
SAP WCM
1 -
SAP Work Clearance Management
1 -
Schedule Agreement
1 -
SD (Sales and Distribution)
1 -
SDM
1 -
security
2 -
Settlement Management
1 -
soar
2 -
Sourcing and Procurement
1 -
SSIS
1 -
SU01
1 -
SUM2.0SP17
1 -
SUMDMO
1 -
Teams
2 -
Time Management
1 -
Transpo
1 -
User Administration
1 -
User Participation
1 -
Utilities
1 -
va01
1 -
vendor
1 -
vl01n
1 -
vl02n
1 -
WCM
1 -
X12 850
1 -
xlsx_file_abap
1 -
YTD|MTD|QTD in CDs views using Date Function
1
- « Previous
- Next »
Related Content
- Discover the World of Poultry: From Farm to Fork with E2E Supply chain in SAP S4HANA Private Cloud in Enterprise Resource Planning Blogs by Members
- AI&ML Managed Email-to-order Automation & Response Service - End to End in Enterprise Resource Planning Blogs by SAP
- footer SAP S/4HANA public Cloud. in Enterprise Resource Planning Q&A
- Driving enterprise transformation with “Clean Core strategy”-Business Process in Enterprise Resource Planning Blogs by SAP
- Streamline Customer Return Management with SAP Business AI in Enterprise Resource Planning Blogs by SAP
Top kudoed authors
| User | Count |
|---|---|
| 6 | |
| 2 | |
| 2 | |
| 2 | |
| 1 | |
| 1 | |
| 1 | |
| 1 | |
| 1 |