- SAP Community
- Products and Technology
- Technology
- Technology Q&A
- Need help for Column Chart css to change the color...
- Subscribe to RSS Feed
- Mark Question as New
- Mark Question as Read
- Bookmark
- Subscribe
- Printer Friendly Page
- Report Inappropriate Content
Need help for Column Chart css to change the colors of the columns in Lumira Designer 2.0 SP1
- Subscribe to RSS Feed
- Mark Question as New
- Mark Question as Read
- Bookmark
- Subscribe
- Printer Friendly Page
- Report Inappropriate Content
on 06-16-2018 4:05 PM
Hello All,
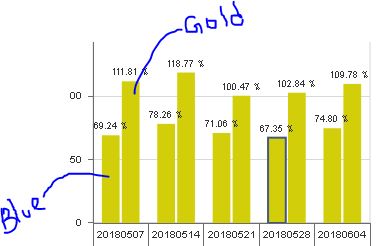
I am using a Lumira designer 2.0 SP1 and chart type is Column Chart. I have two columns in the chart for Measure 1 and Measure 2. I would like to change the colors of the columns individually. right now I have a code provided by one of our valuable member and it is working for me as a group of columns.
.customChart1 g.v-m-main g.v-m-plot g.v-plot-main g.v-datapoint-group .v-datapoint rect{fill: #808080}
Even I wrote few other codes mentioned in other blogs which are not working.Here is the code which is not working
.customChart1 g.v-column g.v-datashape:nth-child(1) rect.v-datapoint.v-morphable-datapoint {fill: yellow !important;}
.customChart1 g.v-column g.v-datashape:nth-child(2) rect.v-datapoint.v-morphable-datapoint {fill: blue;}
.customChart1 g.v-legend-content g.v-row.ID_0 path {fill: yellow;}
.customChart1 g.v-legend-content g.v-row.ID_1 path {fill: blue;}

It would be helpful if I get a list of css classes for all the charts or as well as other components and also I would like to know how to identify a class for a component.
- SAP Managed Tags:
- SAP BusinessObjects Design Studio
- Mark as New
- Bookmark
- Subscribe
- Subscribe to RSS Feed
- Report Inappropriate Content
Hello Rene,
Thanks for addressing my issue.
First part about using chart properties was known to me and I did that. But the conditional formatting was new to me. I will try that and let you know.
Apart from that, here I wanted to know the css script for the chart and use it instead of properties. Out of curiosity I am trying to find all the css classes for chart by right click on the dashboard - select inspect element. I found many classes but unable to use them. tried a lot of combinations to achieve this using css, but nothing is working for me. I would like to know what is the hierarchy like below.
.customChart1 g.v-m-main g.v-m-plot g.v-plot-main g.v-datapoint-group .v-datapoint rect{fill: #808080}
Please need help on understanding this better.
You must be a registered user to add a comment. If you've already registered, sign in. Otherwise, register and sign in.
- Mark as New
- Bookmark
- Subscribe
- Subscribe to RSS Feed
- Report Inappropriate Content
Hi I just tried to create a CSS for a column chart
.Chart g.v-m-main g.v-m-plot g.v-plot-main g.v-datapoint-group .v-datapoint:nth-child(2) rect
{ fill: #ECECED!important;}
.Chart g.v-m-main g.v-m-plot g.v-plot-main g.v-datapoint-group .v-datapoint:nth-child(3) rect
{ fill: #B9BABB!important;}
the nth.child(x) starts at 2 (that is the first column) do not know why it starts at 2 -- but is does, it might be different in your application - so a bit of bungy jumping amongst the numbers might be necessary

- Mark as New
- Bookmark
- Subscribe
- Subscribe to RSS Feed
- Report Inappropriate Content
- Sneak Peek in to SAP Analytics Cloud release for Q2 2024 in Technology Blogs by SAP
- Display of TOP 5 in SAP Lumira in Technology Q&A
- How to get "full control" on columns design in a SAP Analytics cloud table ? in Technology Q&A
- What’s New in SAP Datasphere Version 2024.4 — Feb 13, 2024 in Technology Blogs by Members
- How to easily perform live ad-hoc analysis on SAP BW Queries in SAP Analytics Cloud in Technology Blogs by SAP
| User | Count |
|---|---|
| 75 | |
| 9 | |
| 7 | |
| 6 | |
| 6 | |
| 6 | |
| 6 | |
| 6 | |
| 5 | |
| 4 |
You must be a registered user to add a comment. If you've already registered, sign in. Otherwise, register and sign in.