
- SAP Community
- Products and Technology
- Technology
- Technology Blogs by SAP
- How to identify the SQL statement text from compos...
Technology Blogs by SAP
Learn how to extend and personalize SAP applications. Follow the SAP technology blog for insights into SAP BTP, ABAP, SAP Analytics Cloud, SAP HANA, and more.
Turn on suggestions
Auto-suggest helps you quickly narrow down your search results by suggesting possible matches as you type.
Showing results for
Advisor
Options
- Subscribe to RSS Feed
- Mark as New
- Mark as Read
- Bookmark
- Subscribe
- Printer Friendly Page
- Report Inappropriate Content
2020 Sep 17
6:13 PM
5,267
- SAP Managed Tags:
- SAP HANA
The compositelimit out of memory trace
In SAP HANA there is a way to limit the memory that can be allocated by a single SQL statement (1999997 - FAQ: SAP HANA Memory):
- Starting with SAP HANA 1.0 SPS 08: As a prerequisite you need to have the statement memory tracking feature enabled ( global.ini -> [resource_tracking] -> enable_tracking = on | global.ini -> [resource_tracking] -> memory_tracking = on ). Additionally you have to set the following parameter in order to define the maximum permitted memory allocation per SQL statement and host:global.ini -> [memorymanager] -> statement_memory_limit = <maximum_memory_allocation_in_gb>
- Starting with SAP HANA 2.0 SPS 00 you can define the amount of allocated memory per host for all concurrent database requests:global.ini -> [memorymanager] -> total_statement_memory_limit = <maximum_memory_allocation_in_gb>
After setting the parameter, you may receive a trace like this: <service>_<host>.<port>.rtedump.<timestamp>.compositelimit_oom.trc, which indicates an out of memory situation for a single SQL query.
Since we cannot be always certain from only looking at the trace file, which statement of ours triggered it, we have to do further checks to gather the statement text.
First steps
When opening the compositelimit out of memory trace, the first data we have to note is the "Runtime dump time: 2020/09/09 09:09:09". We will make good use for this later.
In the table of contents you can usually find the following three entries:
- [BUILD] Build information
- [MEMORY_MANAGER] Information about memory manager
- [MEMORY_LIMIT_VIOLATION] Information about current memory composite-limit violation
We have to go to the section [MEMORY_LIMIT_VIOLATION] to gather further details about the out of memory situation. The following can be seen in the trace:
"[MEMORY_LIMIT_VIOLATION] Information about current memory composite-limit violation: (YYYY/MM/DD HH24:MM:SS 123 Local)
Composite limit violation (OUT OF MEMORY) occurred.
Composite limit=500gb (530000000000b)
Root allocator name=Connection/123456/Statement/0123456789101112
..."
We have to note the highlighted part, which tells us the connection id, which is in this example '123456', and the statement id = '0123456789101112'.
With these three piece of data, we can move on to the next phase of our procedure.
Using the SQL Statement Collection
For the next part we will be using statements from SAP Note 1969700 - SQL Statement Collection for SAP HANA.
Do not forget to always use the statement which is appropriate for your HANA version.
(In case of errors with the statements from the note, we can check for the exact error in the table of SAP Note 1969700 - SQL Statement Collection for SAP HANA.)
Collecting the statement hash
Once we download the SQL statement collection, we have to search for the statement: "HANA_Threads_ThreadSamples_FilterAndAggregation". Depending on our HANA revision, we have to open the correct one. With the help of this statement, we will be able to filter the thread sample histories.
We have to go to the "/* Modification section */" of the statement, where we have to alter the corresponding parameters to get the result we seek:
- 'MIN' BEGIN_TIME ->'2020/09/09 09:09:00' BEGIN TIME
- 'MAX' END_TIME -> '2020/09/09 09:15:09' END_TIME
(Based on our example, "Runtime dump time: 2020/09/09 09:09:09")
- '%' STATEMENT_ID -> '0123456789101112' STATEMENT_ID
- -1 CONN_ID -> '123456' CONN_ID
(Based on our example: "Connection/123456/Statement/0123456789101112")
After we set the new parameters, we can execute the statement, to receive the results.

Example output of HANA_Threads_ThreadSamples_FilterAndAggregation statement
We have to search for the statement which started at the noted timestamp. The STATEMENT_HASH column is important for us for the final part of the process. Do not forget to note it. In this example we can see the following statement hash: '3x4mp13st4t3m3nth4shf0rqu3ry4n4ly'.
The exact full statement text cannot be seen form the results, so we have to continue searching for it.
Gathering the statement text
The SQL statement collection offers a statement to gather a collection of details for a specific SQL statement. We will make use of this now.
After opening the corresponding "HANA_SQL_StatementHash_DataCollector" statement for our SAP HANA version, our next stop is the "/* Modification section */" again.
The BEGIN_TIME and END_TIME parameters can be altered to the same values we set earlier for the "HANA_Threads_ThreadSamples_FilterAndAggregation" statement.
Our latest find should also be used, instead of the given 'e1df1b69227985b845d4f3f8135c6688' STATEMENT_HASH, we can insert the statement hash we identified: '3x4mp13st4t3m3nth4shf0rqu3ry4n4ly' STATEMENT_HASH.
The only thing left for us is to execute the statement to get the issues SQL statement, which caused the compositelimit out of memory trace. The full statement text can be found at the result's "STATEMENT TEXT" section, as shown below.
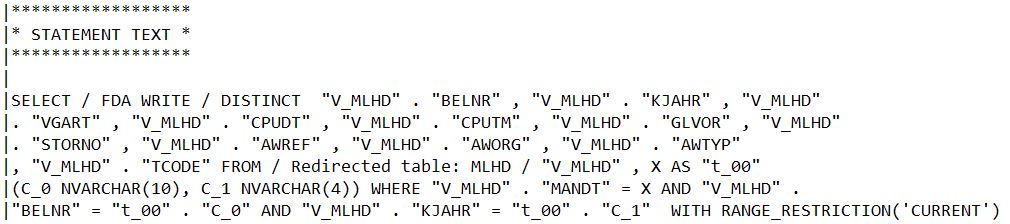
Example output for Statement Text
Follow up actions
Once we identify the issued statement, the next step can be to check SAP KBA 2000002 - FAQ: SAP HANA SQL Optimization, in order to avoid receiving further compositelimit out of memory dumps.
To understand the execution of a SQL statement in detail, there is an option to generate a PlanViz file. We can collect a PlanViz of the specific query as per SAP KBA 2073964 - Create & Export PlanViz in HANA Studio.
Further options exist apart from the PlanViz file generation. We can check them in SAP KBA 2000002 - FAQ: SAP HANA SQL Optimization - answer 9.
Step by Step Instructions
This section is added to sum up the procedure for those, who are already familiar with the process and wish to apply it again quickly at a later time.
- Collect the connection id, the statement id, and the timestamp from the "...compositelimit_oom.trc" trace
- Execute HANA_Threads_ThreadSamples_FilterAndAggregation
-> enter the timestamp you wish to check (in the modification section): YYYY/MM/DD HH24:MM:SS (from the comp oom dump)
-> enter the statement id (in the modification section): '0123456789101112' (from the comp oom dump) OR the thread_id and conn_id
-> execute it
-> in the Result tab, find and note the statement hash of the query - Execute HANA_SQL_StatementHash_DataCollector
-> enter the statement hash (in the modification section): '3x4mp13st4t3m3nth4shf0rqu3ry4n4ly'
-> enter the begin and end times to filter it based on the timestamp from earlier (in the modification section)
Hope it was helpful!
Please leave a comment or suggestion!
Labels:
3 Comments
You must be a registered user to add a comment. If you've already registered, sign in. Otherwise, register and sign in.
Labels in this area
-
ABAP CDS Views - CDC (Change Data Capture)
2 -
Advanced Event Mesh
1 -
ai
1 -
Analyze Workload Data
1 -
BTP
1 -
Business and IT Integration
2 -
Business application stu
1 -
Business Technology Platform
1 -
Business Trends
1,657 -
Business Trends
182 -
CAP
1 -
cf
1 -
Cloud Foundry
1 -
Confluent
1 -
Customer COE Basics and Fundamentals
1 -
Customer COE Latest and Greatest
3 -
Customer Data Browser app
1 -
Data Analysis Tool
1 -
data migration
1 -
data transfer
1 -
Datasphere
2 -
Event Information
1,396 -
Event Information
137 -
Expert
1 -
Expert Insights
177 -
Expert Insights
644 -
General
2 -
Getting Started
2 -
Google cloud
1 -
Google Next'24
1 -
GraphQL
1 -
Introduction
1 -
Kafka
1 -
Life at SAP
779 -
Life at SAP
31 -
Migrate your Data App
1 -
MTA
1 -
Network Performance Analysis
1 -
NodeJS
1 -
PDF
1 -
POC
1 -
Product Updates
4,567 -
Product Updates
673 -
Replication Flow
1 -
REST API
1 -
RisewithSAP
1 -
SAP BTP
1 -
SAP BTP Cloud Foundry
1 -
SAP Cloud ALM
1 -
SAP Cloud Application Programming Model
2 -
SAP Datasphere
2 -
SAP Datasphere تحقيق أقصى استفادة من بيانات الأعمال
1 -
SAP s4hana cloud
1 -
SAP S4HANA Migration Cockpit
1 -
Technology Updates
6,865 -
Technology Updates
815 -
Workload Fluctuations
1
Related Content
- Performance Monitoring in SAP Datasphere in Technology Blogs by Members
- Performance Trace Node.js App on BTP with Dynatrace in Technology Blogs by SAP
- How Metadata Enrichment can enhance SAP HANA Cloud Vector Engine on GenAI scenarios in Technology Blogs by SAP
- French new 2025 legal chart of accounts in Technology Blogs by SAP
- Statement of Direction – SAP Information Steward in Technology Blogs by SAP
Top kudoed authors
| User | Count |
|---|---|
| 26 | |
| 13 | |
| 12 | |
| 11 | |
| 9 | |
| 9 | |
| 7 | |
| 5 | |
| 5 | |
| 5 |