Application Development Blog Posts
Learn and share on deeper, cross technology development topics such as integration and connectivity, automation, cloud extensibility, developing at scale, and security.
cancel
Showing results for 
Search instead for 
Did you mean: 
jasmin_gruschke
Product and Topic Expert

New AMDP Debugger available in ADT starting with release ABAP 7.5. Check how to use it here...

Remarks before you start

  1. All screenshots have been made in an AS ABAP System with SID “HANAABAP” installed in the HANA Database Schema “SAPHANAABAP”.
    Please consider to adapt this based on the System ID (<SID>) and schema of your system.
  2. The screenshots have been created based on HANA Studio version 1.0.7000 and might differ with respect to other HANA releases.

What’s in this document

This document describes how to debug an ABAP Managed Database Procedure in SAP NetWeaver 7.4 SP5 and higher.


For a video tutorial please visit How to debug an ABAP Managed Database Procedure (AMDP) - YouTube.


Prerequisites

In order to debug an ABAP Managed database procedure (AMDP) in AS ABAP 7.4 SP5, an ABAP user as well as a HANA user is required.

We assume that the AMDB is executed via an ABAP report and is subject to a debugging procedure initiated by the HANA user DEBUGUSER.

For the ABAP user the standard ABAP authorization to execute the corresponding report is required.

For the HANA user DEBUGUSER, the authorization to read the catalogue needs to be granted by the SYSTEM user:

     grant catalog read to DEBUGUSER;

Additionally, debugging authorizations are required as described in SAP note 1942471 (http://service.sap.com/sap/support/notes/1942471). According to the note, for SAP HANA releases >= SPS7, three authorizations are required:

  1. Authorization to debug the procedure
  2. Authorization to execute the procedure
  3. Authorization to attach the debugger to a SAP<SID> user session


The corresponding grant statements to be executed in the SQL console of the SAP HANA studio (as SAP<SID> user) for the ABAP Managed DB procedure <AMDP_NAME> are:

grant debug on "SAPHANAABAP"."<AMDP_NAME>" to DEBUGUSER;

grant execute on "SAPHANAABAP"."<AMDP_NAME>" to DEBUGUSER;

grant attach debugger to DEBUGUSER;

Alternatively, the grant statements for the authorization to debug any ABAP Managed database procedure in the schema SAPHANAABAP are:


grant debug  on schema SAPHANAABAP to DEBUGUSER;

grant select on schema SAPHANAABAP to DEBUGUSER;

grant attach debugger to DEBUGUSER;


Remark: For SAP HANA release SPS6, only the authorization to execute SYS.DEBUG is required.

Since ABAP Managed database procedures are created in the HANA catalogue at first execution – during ABAP class activation – you might need to generate the catalogue object before you can start the debugging. For this purpose you can execute the ABAP report RSDBGEN_AMDP.

Step-by-Step Guide: Debug an ABAP Managed DB procedure

Set a Breakpoint

  1. Go to the SAP HANA Development perspective and open the ABAP Managed database procedure (AMDP) catalogue object you would like to debug:
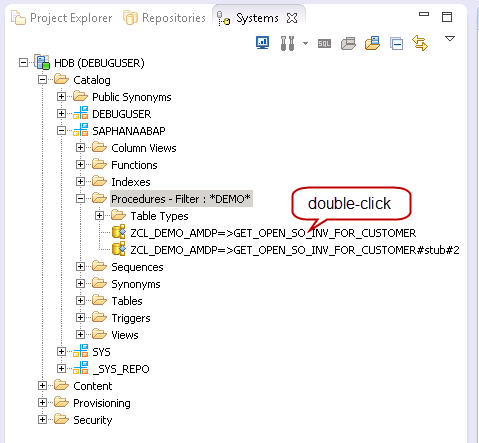
  2. Set the breakpoint:

External Debugging: Attach the SQLScript debugger

  1. Go to the Debug perspective and create a debug configuration:

  2. Create a new SAP HANA Stored Procedure debug configuration and insert the information depicted in the screenshot:

    For the debugging process described in this document, we use the option “Debug an External Session”. The debug user can be selected from the drop down list, in our case the DEBUGUSER. The filter attributes should be as specific as possible. We debug an external session of the “HANA User” SAPHANAABAP, i.e. the user assigned to the primary database connection when running the ABAP report. The user DEVELOPER executes the ABAP report, for this purpose we apply the optional filter on the “Application User”. Finally, click on Apply and start the debugging process via the Debug
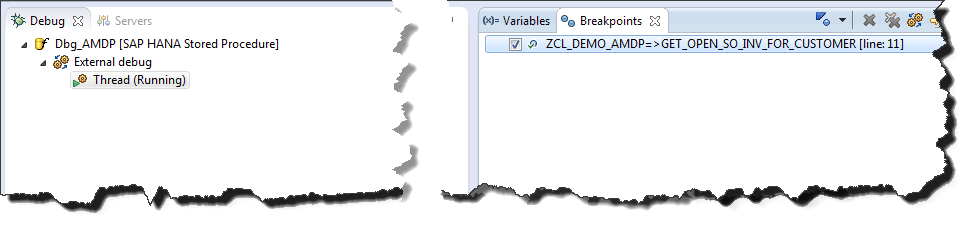
    button.
  3. If everything worked fine you should now see in the debug view that the external debugging is running, and you should additionally see the active break point in the Breakpoints view:

Execution of the ABAP report

In this document, the ABAP report ZR_DEMO_AMDP is executed. In the report the call of the class method zcl_demo_amdp=>get_open_so_inv_for_customer leads to the call of the corresponding AMDP procedure. The coding for both, the ABAP report and the ABAP class, can be found in the attached files.

  1. Switch to the ABAP perspective and execute the ABAP report ZR_DEMO_AMDP (alternatively also the execution of the AMDP via transaction SE24 is possible).
  2. The debugger attaches to the running session and stops at the breakpoint. Switch to the Debug perspective to use all debugging features (this is not mandatory but might become handy):

    You can now use the tools provided by the SQLScript debugger, e.g. you can investigate the values of variables in the Variables view or a data preview of tables
    et_so_inv_h via right-click on the table:

    The data preview is displayed in a corresponding window:

    You can proceed to the next breakpoint (if available) via F8 or just end the current debugging cycle of this procedure (via F8 if no other breakpoints are given).
  3. After this process, the debugger will be in the state described in paragraph "External Debugging: Attach the SQLScript debugger", i.e. the debugger is in external debug mode. Therefore, you can repeat the debug procedure by re-execution of the ABAP report.

Remark: Please explicitely terminate the debugging process once you are finished. The debug procedure described attaches externally to a running session based on certain filter criteria (in our case "HANA user" SAPHANAABAP and "Application user" DEVELOPER) and if an active breakpoint is set. Therefore, you might accidentially/unintentionally debug a colleagues' report execution if the criteria are matched - your colleague then either has to wait until you press F8 or until the debugger time out helps .

Related Content

45 Comments
Former Member
0 Kudos
When I stay in the debugger inside AMDP procedures, ADT will generate an error: "Source not found" with button "Edit source lookup path". What could it be?
Thanks.

jasmin_gruschke
Product and Topic Expert
0 Kudos

Hi Alexander,

at which step does that happen? I have seen something similar when choosing "Procedure to debug" in the Debug Configuration but not with external session debugging.

I think the error raised is not generated by the ADT but rather by the SQLScript debugger in the debugger perspective. The issue arises since the debugger does not know where to find the procedure you'd like to debug. However, you have it open and you have an active breakpoint set, right?

Where exactly did you set the breakpoint? Meaning, you have the system connection, opened the procedure from the Catalog folder and set the breakpoint there, right? Or did you opened the procedure in a local project?

Cheers,

  Jasmin

Former Member
0 Kudos

Yes, you're right, it is a mistake SQLScript Debugger in the debugger perspective. I did everything according to Tutorial, thank you for it. Of course the debugger is configured as an external.Procedure not in local project but all code in temporary package $TMP. Maybe this is the reason? Or problems in the ADT installation...

jasmin_gruschke
Product and Topic Expert
0 Kudos

Hi Alexander,
no, the $TMP package should not lead to an issue and same holds for the ADT installation. You could even do all steps without an ADT installation (except for executing the ABAP report of course :wink: ).

The error you described, is it raised at step 2 of "Execution of the ABAP report" and are you in the debugger perspective? If yes, in which view of the perspective is the described error raised?

You can also drop me a mail with a screenshot if you like.

Cheers,

  Jasmin

Former Member
0 Kudos

I reinstalled HANA Studio + ADT
Everything worked, thank you, Jasmin!

0 Kudos

Hello I am facing the same issue of  "Source not found" with button "Edit source lookup path".

Any input on the issue shall be highly appreciated .

Thanks in advance. :smile:

Regrads,

Abhishek

jasmin_gruschke
Product and Topic Expert
0 Kudos

Hi Abhishek,
I suspect some missing authorizations. Can you please check if all authorizations have been granted (e.g. via ADBC)?

Cheers,

  Jasmin

0 Kudos

Hi All,

I am also getting the same problem "Source not found" with button "Edit source lookup path".

I got all the authorizations which were mentioned above.

Can you please let us know what is missing here.

Thanks in Advance.

Viswa..

0 Kudos

Hi All,

I have re-installed now i am able to see the code.

Thanks

Viswa

0 Kudos

Hi All,

F5,F6,F7,F8 buttons are disable for me to debug.

Is there any special authorization is required for this.

Thanks & Regards,

Viswamurthy

jasmin_gruschke
Product and Topic Expert
0 Kudos

Hi Viswamurthy,
the step-in (F5), single step (F6), and step-out (F7) functionality is currently not provided by the SQLScript Debugger.
What is a bit puzzling is the missing F8 functionality. Are you in the right perspective when debugging? Is the F8 "shortcut" working, i.e. can you resume the debugger using the F8 key and just the button seems to be inactive?

Cheers,

  Jasmin

0 Kudos

Hi Jasmin,

Thanks for your response.

Yaa F8 shortcut is working fine for me but the thread that is created in the debug configuration is working only one time per execution, i mean if i want to debug more times i need to terminate and relaunch the debug configuration for those many times.

Thanks & Regards,

Viswa

Former Member
0 Kudos

Hi,

I followed this excellent guide and the video on the subject of debugging.

I have performed all the steps and everything looks as described above except when I execute the ABAP report. Nothing happens. The report runs through successfully but there is no stop at the break-point.

What could be the reason for this?

System HANASP7 BW740SP5.

jasmin_gruschke
Product and Topic Expert
0 Kudos

For bookkeeping: Issue solved :-).

maqsood_ahmed
Explorer
0 Kudos

Hi ,

I am unable to debug NESTED AMDPs , When i put a breakpoint in inner AMDP procedure and execute my abap transaction,it simply hangs, debugger hasn't stop anywhere either.

p.s : Non-NESTED AMDP debug works.

Please advice

0 Kudos

This can be avoided while setting debug configuration. Select Procedures with breakpints under advanced tab and it will hit the procedure where breakpoint is set. ( You need to set all the breakpoints in all the procedure where you want to to debug before starting debugging while working with this option. )

maqsood_ahmed
Explorer
0 Kudos

Hi Abhishek ,

You are correct, now the breakpoints are reached in the NESTED procedure.

However I have a strange behavior in one of the NESTED procedures,

The breakpoints are shows as crossed, not like normal ones, the debugger doesn't stop here either. but it does stop at other NESTED procedures where breakpoints are not crossed(pic attached), any idea why? I have activated the procedure, it also works and returns results but cannot be debugged

0 Kudos

Your breakpoits got invalidated may be because of change in procedure or other issues  which can be resolved by :

1. Resetting your breakpoits.

2. Restart your eclipse.

jasmin_gruschke
Product and Topic Expert
0 Kudos

Hi Ahmed,
you may check that you granted all necessary authorizations, i.e. the authorization also for debugging the inner procedure?

More over, make sure that all required breakpoints are set once you start the desired breakpoints.

Cheers,
  Jasmin

Former Member
0 Kudos

Hi Jasmin,

How to find HANA Database Schema name? I am working on system where SID is ERP, should i search in SAPERP schema? But i could not able to find SAPERP schema name in HANA database.

Thanks a lot for your guidance and support.

jasmin_gruschke
Product and Topic Expert
0 Kudos

Hi Vipin,

are you working on the "default" connection of the ABAP server to the database? If yes, please have a look at the "System -> Status" of your ABAP server, there you can see an information section on "Database data", the owner is the DB user, which is typically identical to the database schema name.

This is only true for the default connection. If you are using a dedicated secondary database connection, you can find the database user (and thus the name of the database schema) in the database connection (transaction DBCO).

Cheers,
  Jasmin

Former Member
0 Kudos

Hi Jasmin,

SID is 3 character string, not sure why did we took HANAABAP as SID here?

Thanks

jasmin_gruschke
Product and Topic Expert
0 Kudos

Hi Vipin,

the data element SYSID is used for the SID, which is a CHAR30. But you're right, I've been a bit unprecise in my documents. The SID is actually A4H but the HANA user is SAPHANAABAP. As the "typical standard" is to have an SAP<SID> user as database user for the ABAP to connect to the DB, I explained it like that. You can find the HANA DB user name corresponding to SAPHANAABAP in my explaination when you have a look (e.g. in the SAPGui) at System > Status. There you'll see the DB user as well as version information, ports, etc.

Cheers,
  Jasmin

Former Member
0 Kudos

Hi Jasmin,

What will happen if I put a break point inside a method body in ABAP perspective instead of setting up break point in database procedure.

Thanks

jasmin_gruschke
Product and Topic Expert
0 Kudos

Hi Vipin,
true AMDP debugging is much more comfortable, yet you need a high enough SAP_BASIS as well as HANA release. :-).
Cheers,
  Jasmin

Former Member
0 Kudos

hi Jasmin, thanks a lot for you reply.

Till which release we need to create explicit debug configuration?

Or from which release AMDP debugging become simpler?

Thanks

jasmin_gruschke
Product and Topic Expert
0 Kudos

Hi Vipin,
for AMDP debugging, you'll need at least ABAP 7.4 SP8 (so the SAP_BASIS 740 SP8) and a HANA running on SPS9.

Yet, even in this releases an explicit debuggin via the HANA console is still necessary for some cases, debugging of native HANA procedures (e.g. if it's called via ADBC or attached to a Database Procedure Proxy).

Cheers,
  Jasmin

0 Kudos

Hi Jasmin,

Just to confirm. So I have a system is running ABAP 7.4 SP11 and HANA SPS 8.

So I wont be able to debug AMDPs. Isn't it the case?

Thanks,

Jay

thomasgauweiler
Active Participant
0 Kudos

Hi Jay,

with your HANA version you cannot use the integrated AMDP debugging.

You can debug AMDPs only by the way described in this article here.

Regards, Thomas

0 Kudos

Hi Thomas,

Thanks for the reply.

What do you mean by "integrated AMDP debugging"?
I thought the only way to debug AMPDs is the way described in this article. :smile:

Thanks,

Jay

thomasgauweiler
Active Participant
0 Kudos

Hi Jay,

the integrated AMDP debugging that Jasmin mention in this part of the comments is itegral part of the AMD-Editor. You just set a Breakpoint in your source code. No need for HANA stuio. But for this you need, (as mentioned) at least ABAP 7.4 SP8 and HANA SPS9.

Thomas

torsten_wirth
Participant
0 Kudos

Hi,

we are on 7.4 SP14 combined with HANA SP11 and latest version of modelling tools. If I set a breakpoint in a procedure which is created via AMDP then I'm getting a dump and the error:

"transaction rolled back by an internal error: exception 70000000: The

attached Debugger compiled some procedures in debug mode on-the-fly. Please

restart your statement in order to debug them.#"

If I repeat it I'm getting the same result. Does anyone has an idea what the problem is?

Regards,

Torsten

Armin_Beil
Product and Topic Expert
0 Kudos

Hello Torsten,

to deal with your issue you can try to choose the setting "Compile a debug execution plan for:" - "Procedures with breakpoints" in the debug configuration of your HANA Studio.

Using the value "All procedures in the call stack" can cause the issue you mentioned with HDB SPS 10 and 11. To understand what the setting means you should also take a look at the section "Debug Mode" of this blog:

How to debug ABAP Managed Database Procedures using ADT - Details and Tips

Once you activated the new setting the procedures without breakpoints may be executed in optimized mode which can cause side effects during debugging. If you face side effects, e.g. debugger is not stopping at a breakpoint, try to create an additional breakpoint in the calling procedure (one level higher) in order to force it into debug mode.

Note that in the context of AMDP the top level procedure is the stub procedure. The stub is named like "<your_amdp_name>#stub...". If your debugger is not stopping at breakpoints try to create an additional BP directly in the stub.

Once you updated to HDB SPS12 you should be able to use the initial setting value again without issues. Or if you updated to NW 7.5 you can use the ADT AMDP Debugger (How to debug ABAP Managed Database Procedures using ADT - Basics) which is overall more convenient to debug AMDPs.

Best regards,

Armin

torsten_wirth
Participant
0 Kudos

Hello Armin,

Thank you for your fast reply. I have changed the setting but now I have another strange behaviour. I have set breakpoints in several procedures now (to be on the save side in all 3 procedures which are created automatically). But allthough the debug configuration is running there is not stop at the breakpoints. Furthermore as soon as I switch to debug mode by running the configuration all breakpoint are changing the status to "catalog lookup failed":

Is this normal behaviour?

Currently we are running a sandbox but after that we will use SPS12 for HANA for system migration.

Regards,

Torsten

torsten_wirth
Participant
0 Kudos

This behaviour seems to be connected to HANA Studio version. I have used an older version now (before I used the latest version) and with the older version debugging is basically working but not for every call. I see every step for the first call in the screenshot - which means HANA procedure debugging is working (the first call is simply for creating the procedure if it is not already created on HANA).

The second call is the one which creates planning data in a planning function on BW and this is skipped on HANA:

The second call is the important one and is skipped.

I have tried debugging now for own planning function type in BW and for characteristic derivation type exit - for both debugging is skipped.

Armin_Beil
Product and Topic Expert
0 Kudos

Hi Torsten,

I'm not completely sure about these issues but I would guess the following:

1) "Catalog lookup failed. procedure does not exist": Maybe this can be resolved by executing the AMDP / DB procedure once initially before you create breakpoints etc. You said it's depending on your Studio version but maybe it also worked in the older version simply because it was then executed for the second time (?). Personally I would retry it with the newer Studio version one more time to see if it works now.

2) Debugger is not stopping in the second call: Unfortunately the overall setup that you have (Combination of Studio/NW/HDB versions) is not ideal for debugging AMDPs. In your setup probably only the first creation of new debug session is reliable.

That means if you enter procedure debugging initially its reliable. Within this initial debug session all breakpoints should be respected. When you leave to ABAP your first debug session will end.

If you then try to re-enter procedures (the same or a different one) and reach a procedure breakpoint a second procedure debug session should be started in HANA Studio but this is not reliable and will not work most of the times.

So you have two options now:

1. Do not debug the call of MON_TO_DAY() so the second call becomes the first/only call and can be debugged reliable.

2. Start by debugging the first call. Once you left from procedure debugging to ABAP debugger, manually restart the procedure debugger in HANA Studio before you resume in ABAP Debugger.

Best regards,

Armin

torsten_wirth
Participant
0 Kudos

Hello Armin,

1) No, it does not help to execute it several times. This is simply not working with my installation of HANA Studio. I have tried that more than 20 times now (the procedures are there). You can see that also on the screenshots. If the procedures do not exist they will not be shown in HANA Modeler

2) Ok, good to know. Now it is working. I thougt this is working like ABAP Debugger where it is no problem to stop when you have several calls. I have decided for the 2nd option which is not very convinient but working.

If there is another option to check if the procedure is created instead of calling it to be sure that it is created I don't know it. In my opinion this should be done by the planning framework if AMDPs are allowed but this is another topic.

Thank you for the help.

Regards,

Torsten

Former Member
0 Kudos

Hi,

To debug AMDP in 7.4, we need above mentioned authorization to be granted by System SID user.

Normally we have lot of developers . To grant such authorization to each and every user, it needs to be done by system user SID.

Is there any way this privileges can be attached to a role and role can be assigned to HANA DB user ID.

Isn't it concern if for each and every DB user, this authorization has to be granted individually by System SID.

diwaneamit
Participant
0 Kudos
Hello Jasmin,

How can we call an Instance AMDP method inside another AMDP (Static/Instance) method? I checked the approach of calling the static AMDP method which works perfectly fine but want to check for instance AMDP method calling.


n_soni
Participant
0 Kudos
F5,F6,F7,F8 buttons are still disable for me to debug.

I'm using HANA Studio Version: 2.1.16

Is it available now any version HANA Studio?
former_member205429
Contributor
0 Kudos
Hi,


I am facing issues during SAP HANA  Debug - HANA Authorization error :


Can any one please advise.


Thank You,

Santhosh
0 Kudos
Hi Jasmin,

I understand this is a very old post of yours. You have mentioned this feature is available from NW 7.4 and higher. But there are other posts in the internet which says this feature is only available from NW 7.5. When I tried to set a breakpoint in NW 7.4 I got the information message saying "AMDP Debugger is not available for the current system".

I hope this comment is useful for all other NW 7.4 users.

Cheers

Ashok
0 Kudos
Hi Jasmin,

It was was a very nice blog and will help everyone in a lower SP level in SAP HANA  to debug an AMDP.I have few questions if answered will help us in moving forward.

  1. We @ our organization are in HANA 1.0 SP 13 and as per the blog with the current version we can only debug at the HANA DB level because we are putting debugging at the stored procedure only and not at the application level.Is this an SAP recommended option if our current landscape is on BW on HANA and roles and authorization's are maintained at the BW level and not at HANA DB level.

  2. When we go to BW 7.5 on HANA so is that the debugging doesn't happen at the HANA DB level and rather at the application level and just want to understand when we say application level debugging for AMDP in 7.5 how does it work.

sagarprusty1988
Explorer
0 Kudos
It is similar to the RFC debugging.
But in this case we need to debug the stored procedure created in run time by the AMDP method. Very good post.
sagarprusty1988
Explorer
0 Kudos
Please check your HANA prospective logon.
It should be active.
Labels in this area